Bahamian vs Immigrants from Zimbabwe Per Capita Income
COMPARE
Bahamian
Immigrants from Zimbabwe
Per Capita Income
Per Capita Income Comparison
Bahamians
Immigrants from Zimbabwe
$36,427
PER CAPITA INCOME
0.0/ 100
METRIC RATING
313th/ 347
METRIC RANK
$47,394
PER CAPITA INCOME
98.5/ 100
METRIC RATING
93rd/ 347
METRIC RANK
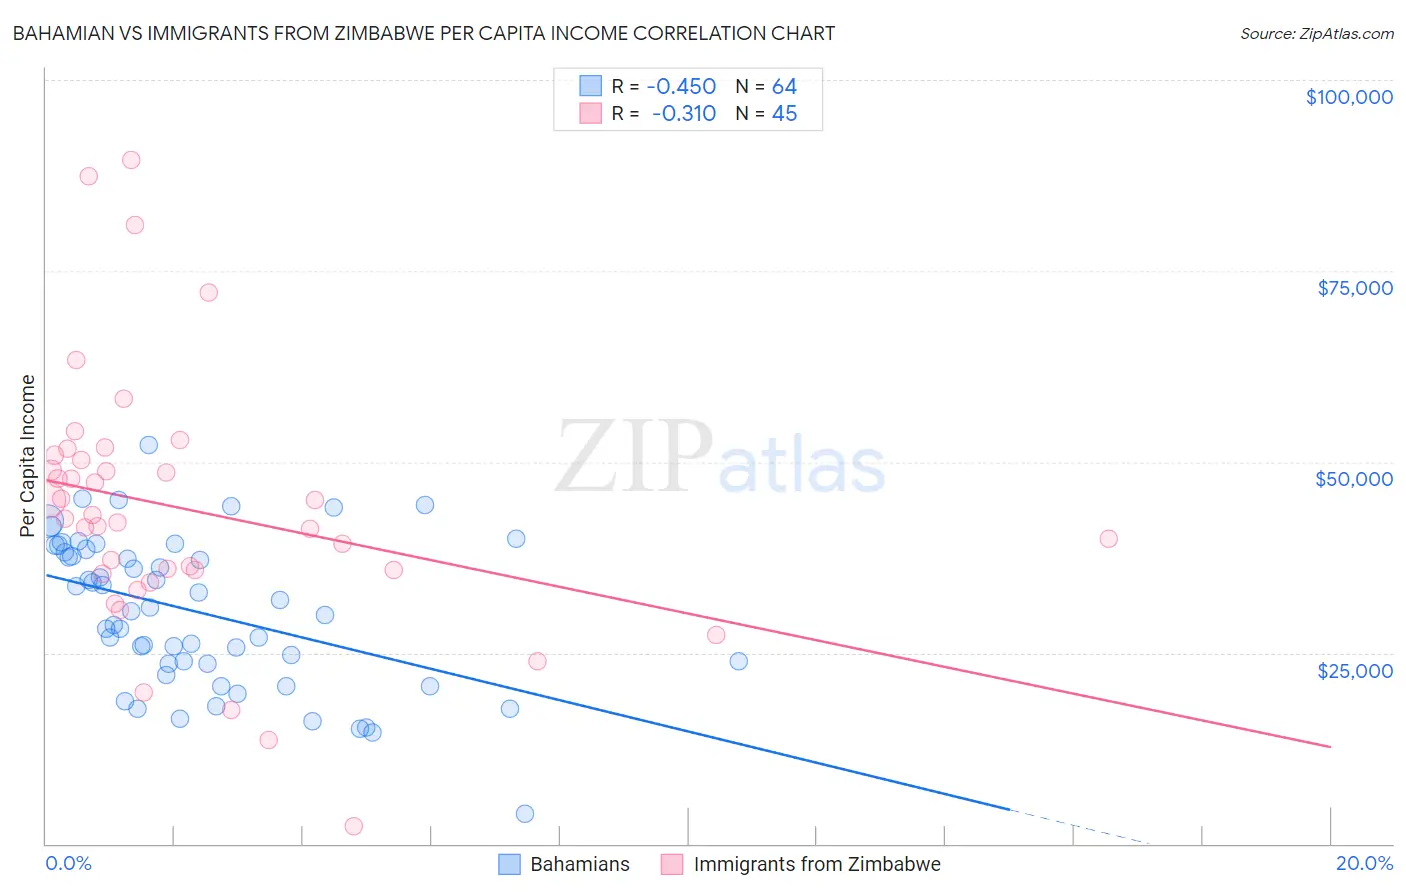
Bahamian vs Immigrants from Zimbabwe Per Capita Income Correlation Chart
The statistical analysis conducted on geographies consisting of 112,707,980 people shows a moderate negative correlation between the proportion of Bahamians and per capita income in the United States with a correlation coefficient (R) of -0.450 and weighted average of $36,427. Similarly, the statistical analysis conducted on geographies consisting of 117,813,757 people shows a mild negative correlation between the proportion of Immigrants from Zimbabwe and per capita income in the United States with a correlation coefficient (R) of -0.310 and weighted average of $47,394, a difference of 30.1%.
Per Capita Income Correlation Summary
| Measurement | Bahamian | Immigrants from Zimbabwe |
| Minimum | $3,864 | $2,302 |
| Maximum | $52,210 | $89,578 |
| Range | $48,346 | $87,276 |
| Mean | $30,310 | $43,763 |
| Median | $30,639 | $42,560 |
| Interquartile 25% (IQ1) | $23,571 | $35,574 |
| Interquartile 75% (IQ3) | $38,367 | $50,554 |
| Interquartile Range (IQR) | $14,797 | $14,981 |
| Standard Deviation (Sample) | $9,801 | $17,068 |
| Standard Deviation (Population) | $9,724 | $16,878 |
Similar Demographics by Per Capita Income
Demographics Similar to Bahamians by Per Capita Income
In terms of per capita income, the demographic groups most similar to Bahamians are Chickasaw ($36,475, a difference of 0.13%), Chippewa ($36,631, a difference of 0.56%), Ute ($36,651, a difference of 0.62%), Immigrants from Honduras ($36,665, a difference of 0.65%), and Seminole ($36,180, a difference of 0.68%).
| Demographics | Rating | Rank | Per Capita Income |
| Immigrants | Haiti | 0.0 /100 | #306 | Tragic $36,849 |
| Immigrants | Latin America | 0.0 /100 | #307 | Tragic $36,823 |
| Fijians | 0.0 /100 | #308 | Tragic $36,690 |
| Immigrants | Honduras | 0.0 /100 | #309 | Tragic $36,665 |
| Ute | 0.0 /100 | #310 | Tragic $36,651 |
| Chippewa | 0.0 /100 | #311 | Tragic $36,631 |
| Chickasaw | 0.0 /100 | #312 | Tragic $36,475 |
| Bahamians | 0.0 /100 | #313 | Tragic $36,427 |
| Seminole | 0.0 /100 | #314 | Tragic $36,180 |
| Yaqui | 0.0 /100 | #315 | Tragic $36,112 |
| Choctaw | 0.0 /100 | #316 | Tragic $35,999 |
| Dutch West Indians | 0.0 /100 | #317 | Tragic $35,922 |
| Bangladeshis | 0.0 /100 | #318 | Tragic $35,897 |
| Immigrants | Congo | 0.0 /100 | #319 | Tragic $35,720 |
| Hispanics or Latinos | 0.0 /100 | #320 | Tragic $35,688 |
Demographics Similar to Immigrants from Zimbabwe by Per Capita Income
In terms of per capita income, the demographic groups most similar to Immigrants from Zimbabwe are Albanian ($47,379, a difference of 0.030%), Immigrants from Egypt ($47,361, a difference of 0.070%), Immigrants from Moldova ($47,489, a difference of 0.20%), Alsatian ($47,284, a difference of 0.23%), and Carpatho Rusyn ($47,248, a difference of 0.31%).
| Demographics | Rating | Rank | Per Capita Income |
| Immigrants | Southern Europe | 99.3 /100 | #86 | Exceptional $48,027 |
| Ukrainians | 99.3 /100 | #87 | Exceptional $48,014 |
| Croatians | 99.0 /100 | #88 | Exceptional $47,742 |
| Northern Europeans | 98.9 /100 | #89 | Exceptional $47,698 |
| Italians | 98.8 /100 | #90 | Exceptional $47,574 |
| Macedonians | 98.8 /100 | #91 | Exceptional $47,573 |
| Immigrants | Moldova | 98.7 /100 | #92 | Exceptional $47,489 |
| Immigrants | Zimbabwe | 98.5 /100 | #93 | Exceptional $47,394 |
| Albanians | 98.5 /100 | #94 | Exceptional $47,379 |
| Immigrants | Egypt | 98.5 /100 | #95 | Exceptional $47,361 |
| Alsatians | 98.3 /100 | #96 | Exceptional $47,284 |
| Carpatho Rusyns | 98.2 /100 | #97 | Exceptional $47,248 |
| Immigrants | Pakistan | 97.9 /100 | #98 | Exceptional $47,084 |
| Laotians | 97.8 /100 | #99 | Exceptional $47,041 |
| Immigrants | Lebanon | 97.5 /100 | #100 | Exceptional $46,938 |