Bahamian vs Immigrants from Venezuela Per Capita Income
COMPARE
Bahamian
Immigrants from Venezuela
Per Capita Income
Per Capita Income Comparison
Bahamians
Immigrants from Venezuela
$36,427
PER CAPITA INCOME
0.0/ 100
METRIC RATING
313th/ 347
METRIC RANK
$41,727
PER CAPITA INCOME
10.2/ 100
METRIC RATING
213th/ 347
METRIC RANK
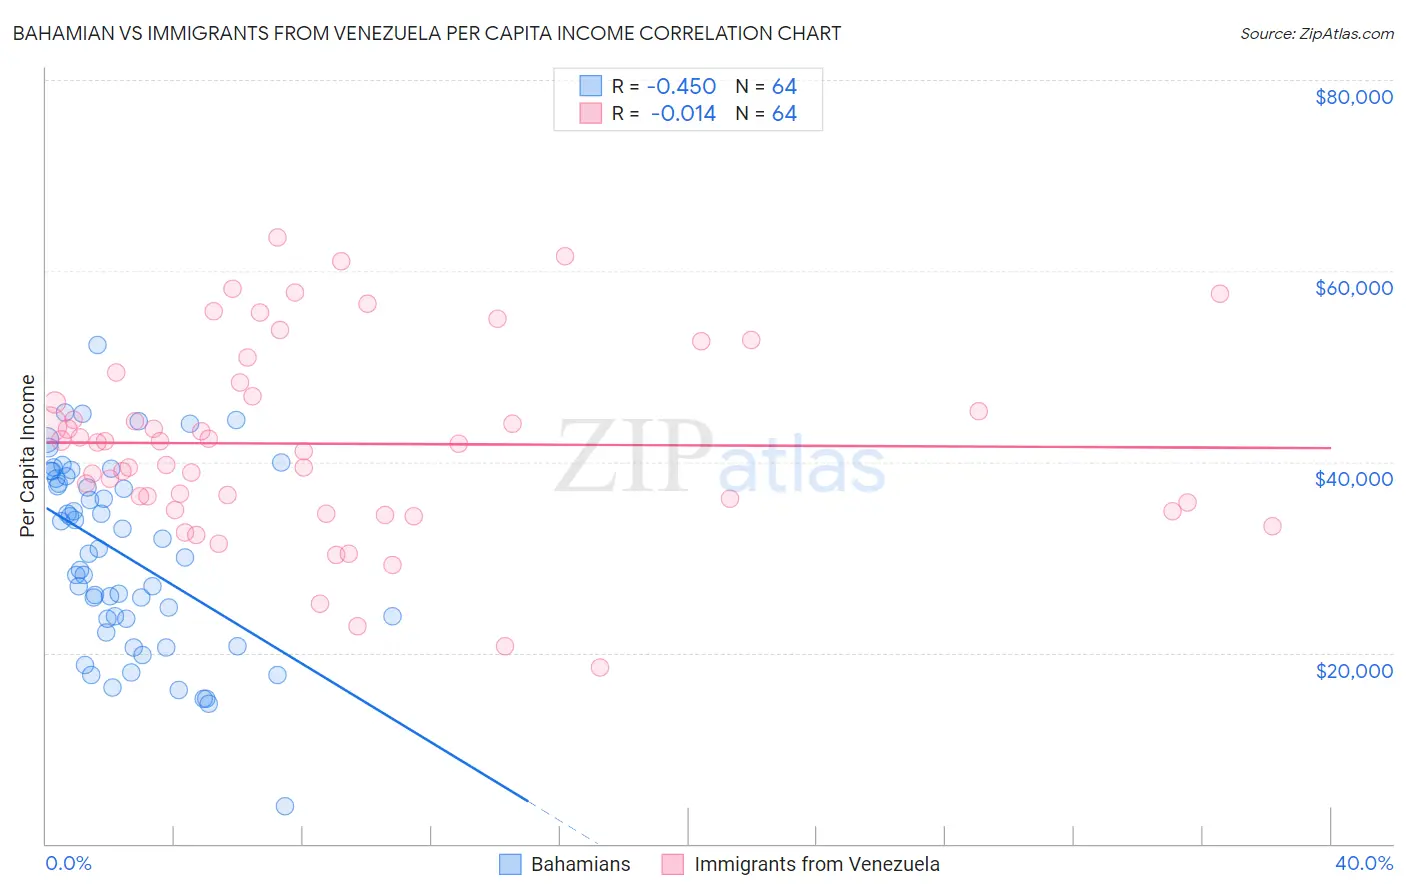
Bahamian vs Immigrants from Venezuela Per Capita Income Correlation Chart
The statistical analysis conducted on geographies consisting of 112,707,980 people shows a moderate negative correlation between the proportion of Bahamians and per capita income in the United States with a correlation coefficient (R) of -0.450 and weighted average of $36,427. Similarly, the statistical analysis conducted on geographies consisting of 287,848,526 people shows no correlation between the proportion of Immigrants from Venezuela and per capita income in the United States with a correlation coefficient (R) of -0.014 and weighted average of $41,727, a difference of 14.5%.
Per Capita Income Correlation Summary
| Measurement | Bahamian | Immigrants from Venezuela |
| Minimum | $3,864 | $18,497 |
| Maximum | $52,210 | $63,503 |
| Range | $48,346 | $45,006 |
| Mean | $30,310 | $41,894 |
| Median | $30,639 | $41,937 |
| Interquartile 25% (IQ1) | $23,571 | $35,384 |
| Interquartile 75% (IQ3) | $38,367 | $47,592 |
| Interquartile Range (IQR) | $14,797 | $12,208 |
| Standard Deviation (Sample) | $9,801 | $10,042 |
| Standard Deviation (Population) | $9,724 | $9,963 |
Similar Demographics by Per Capita Income
Demographics Similar to Bahamians by Per Capita Income
In terms of per capita income, the demographic groups most similar to Bahamians are Chickasaw ($36,475, a difference of 0.13%), Chippewa ($36,631, a difference of 0.56%), Ute ($36,651, a difference of 0.62%), Immigrants from Honduras ($36,665, a difference of 0.65%), and Seminole ($36,180, a difference of 0.68%).
| Demographics | Rating | Rank | Per Capita Income |
| Immigrants | Haiti | 0.0 /100 | #306 | Tragic $36,849 |
| Immigrants | Latin America | 0.0 /100 | #307 | Tragic $36,823 |
| Fijians | 0.0 /100 | #308 | Tragic $36,690 |
| Immigrants | Honduras | 0.0 /100 | #309 | Tragic $36,665 |
| Ute | 0.0 /100 | #310 | Tragic $36,651 |
| Chippewa | 0.0 /100 | #311 | Tragic $36,631 |
| Chickasaw | 0.0 /100 | #312 | Tragic $36,475 |
| Bahamians | 0.0 /100 | #313 | Tragic $36,427 |
| Seminole | 0.0 /100 | #314 | Tragic $36,180 |
| Yaqui | 0.0 /100 | #315 | Tragic $36,112 |
| Choctaw | 0.0 /100 | #316 | Tragic $35,999 |
| Dutch West Indians | 0.0 /100 | #317 | Tragic $35,922 |
| Bangladeshis | 0.0 /100 | #318 | Tragic $35,897 |
| Immigrants | Congo | 0.0 /100 | #319 | Tragic $35,720 |
| Hispanics or Latinos | 0.0 /100 | #320 | Tragic $35,688 |
Demographics Similar to Immigrants from Venezuela by Per Capita Income
In terms of per capita income, the demographic groups most similar to Immigrants from Venezuela are Immigrants from Bangladesh ($41,709, a difference of 0.040%), Sudanese ($41,695, a difference of 0.080%), Tongan ($41,693, a difference of 0.080%), Guamanian/Chamorro ($41,678, a difference of 0.12%), and Trinidadian and Tobagonian ($41,655, a difference of 0.17%).
| Demographics | Rating | Rank | Per Capita Income |
| Ghanaians | 15.7 /100 | #206 | Poor $42,164 |
| Venezuelans | 14.4 /100 | #207 | Poor $42,074 |
| Panamanians | 13.9 /100 | #208 | Poor $42,035 |
| Immigrants | Sudan | 13.2 /100 | #209 | Poor $41,986 |
| Ecuadorians | 12.9 /100 | #210 | Poor $41,958 |
| Immigrants | Panama | 11.6 /100 | #211 | Poor $41,853 |
| Immigrants | Senegal | 11.3 /100 | #212 | Poor $41,830 |
| Immigrants | Venezuela | 10.2 /100 | #213 | Poor $41,727 |
| Immigrants | Bangladesh | 10.1 /100 | #214 | Poor $41,709 |
| Sudanese | 9.9 /100 | #215 | Tragic $41,695 |
| Tongans | 9.9 /100 | #216 | Tragic $41,693 |
| Guamanians/Chamorros | 9.7 /100 | #217 | Tragic $41,678 |
| Trinidadians and Tobagonians | 9.5 /100 | #218 | Tragic $41,655 |
| Puget Sound Salish | 8.1 /100 | #219 | Tragic $41,495 |
| Immigrants | Barbados | 7.9 /100 | #220 | Tragic $41,478 |