Bahamian vs Soviet Union Master's Degree
COMPARE
Bahamian
Soviet Union
Master's Degree
Master's Degree Comparison
Bahamians
Soviet Union
12.4%
MASTER'S DEGREE
0.5/ 100
METRIC RATING
266th/ 347
METRIC RANK
20.5%
MASTER'S DEGREE
100.0/ 100
METRIC RATING
18th/ 347
METRIC RANK
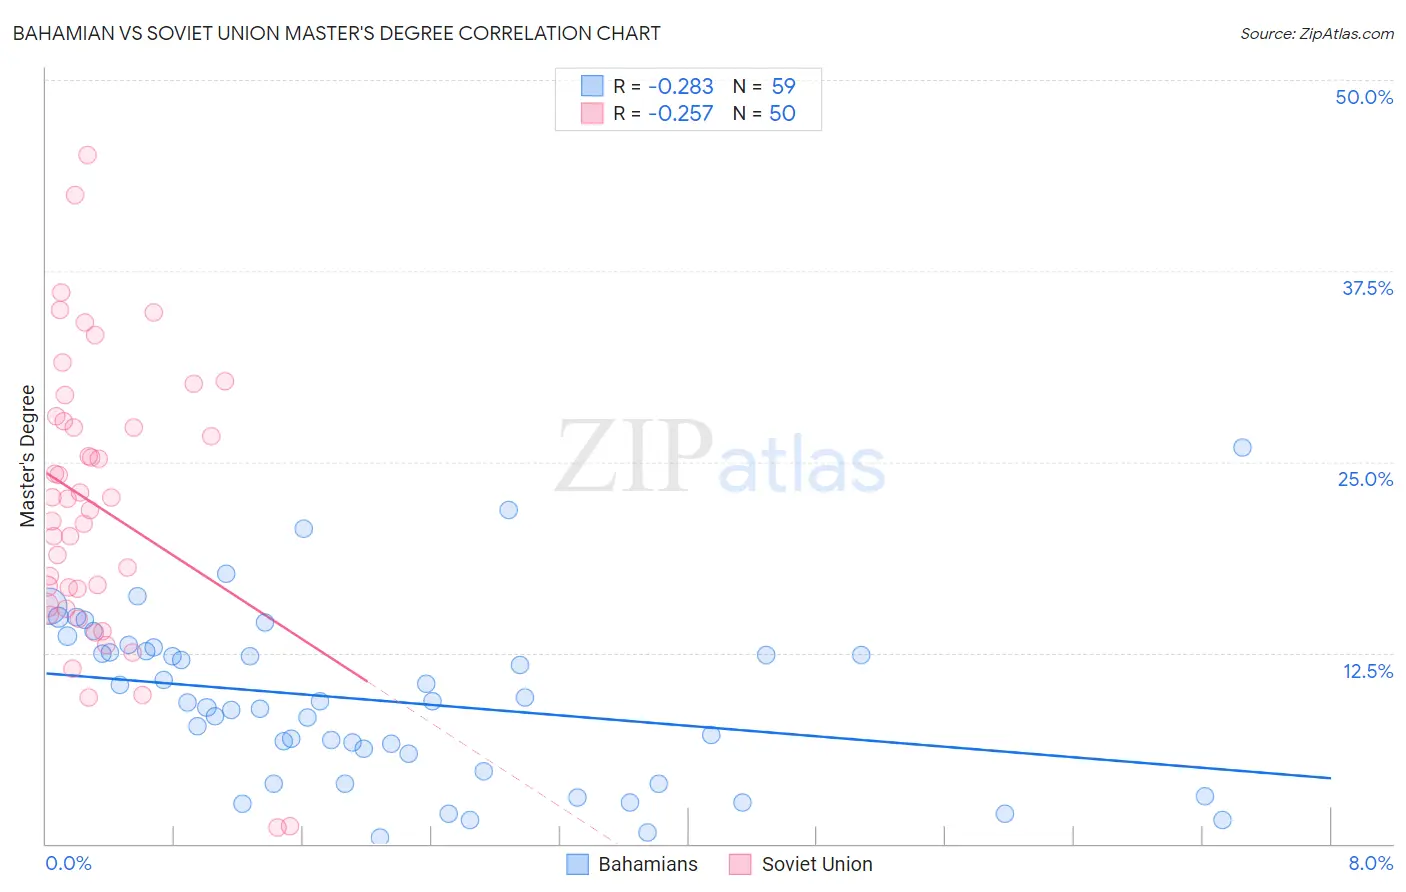
Bahamian vs Soviet Union Master's Degree Correlation Chart
The statistical analysis conducted on geographies consisting of 112,667,548 people shows a weak negative correlation between the proportion of Bahamians and percentage of population with at least master's degree education in the United States with a correlation coefficient (R) of -0.283 and weighted average of 12.4%. Similarly, the statistical analysis conducted on geographies consisting of 43,514,626 people shows a weak negative correlation between the proportion of Soviet Union and percentage of population with at least master's degree education in the United States with a correlation coefficient (R) of -0.257 and weighted average of 20.5%, a difference of 65.6%.
Master's Degree Correlation Summary
| Measurement | Bahamian | Soviet Union |
| Minimum | 0.39% | 1.0% |
| Maximum | 25.9% | 45.1% |
| Range | 25.5% | 44.1% |
| Mean | 9.4% | 22.1% |
| Median | 9.3% | 22.2% |
| Interquartile 25% (IQ1) | 4.7% | 15.6% |
| Interquartile 75% (IQ3) | 12.6% | 27.6% |
| Interquartile Range (IQR) | 7.9% | 12.0% |
| Standard Deviation (Sample) | 5.5% | 9.2% |
| Standard Deviation (Population) | 5.4% | 9.1% |
Similar Demographics by Master's Degree
Demographics Similar to Bahamians by Master's Degree
In terms of master's degree, the demographic groups most similar to Bahamians are Immigrants from Fiji (12.4%, a difference of 0.16%), Belizean (12.4%, a difference of 0.18%), Central American Indian (12.4%, a difference of 0.34%), Nicaraguan (12.5%, a difference of 0.58%), and Tongan (12.5%, a difference of 0.76%).
| Demographics | Rating | Rank | Master's Degree |
| Japanese | 0.6 /100 | #259 | Tragic 12.5% |
| Dominicans | 0.6 /100 | #260 | Tragic 12.5% |
| Tongans | 0.6 /100 | #261 | Tragic 12.5% |
| Nicaraguans | 0.6 /100 | #262 | Tragic 12.5% |
| Central American Indians | 0.5 /100 | #263 | Tragic 12.4% |
| Belizeans | 0.5 /100 | #264 | Tragic 12.4% |
| Immigrants | Fiji | 0.5 /100 | #265 | Tragic 12.4% |
| Bahamians | 0.5 /100 | #266 | Tragic 12.4% |
| Americans | 0.4 /100 | #267 | Tragic 12.3% |
| Native Hawaiians | 0.4 /100 | #268 | Tragic 12.3% |
| Central Americans | 0.3 /100 | #269 | Tragic 12.2% |
| Salvadorans | 0.3 /100 | #270 | Tragic 12.2% |
| Haitians | 0.3 /100 | #271 | Tragic 12.1% |
| Comanche | 0.3 /100 | #272 | Tragic 12.1% |
| Blackfeet | 0.3 /100 | #273 | Tragic 12.1% |
Demographics Similar to Soviet Union by Master's Degree
In terms of master's degree, the demographic groups most similar to Soviet Union are Immigrants from Hong Kong (20.5%, a difference of 0.35%), Indian (Asian) (20.5%, a difference of 0.37%), Immigrants from Ireland (20.4%, a difference of 0.48%), Israeli (20.3%, a difference of 0.90%), and Immigrants from South Central Asia (20.7%, a difference of 0.92%).
| Demographics | Rating | Rank | Master's Degree |
| Immigrants | China | 100.0 /100 | #11 | Exceptional 21.2% |
| Eastern Europeans | 100.0 /100 | #12 | Exceptional 21.1% |
| Immigrants | Australia | 100.0 /100 | #13 | Exceptional 20.9% |
| Immigrants | Switzerland | 100.0 /100 | #14 | Exceptional 20.9% |
| Immigrants | Eastern Asia | 100.0 /100 | #15 | Exceptional 20.8% |
| Immigrants | Belgium | 100.0 /100 | #16 | Exceptional 20.8% |
| Immigrants | South Central Asia | 100.0 /100 | #17 | Exceptional 20.7% |
| Soviet Union | 100.0 /100 | #18 | Exceptional 20.5% |
| Immigrants | Hong Kong | 100.0 /100 | #19 | Exceptional 20.5% |
| Indians (Asian) | 100.0 /100 | #20 | Exceptional 20.5% |
| Immigrants | Ireland | 100.0 /100 | #21 | Exceptional 20.4% |
| Israelis | 100.0 /100 | #22 | Exceptional 20.3% |
| Immigrants | France | 100.0 /100 | #23 | Exceptional 20.3% |
| Immigrants | Sweden | 100.0 /100 | #24 | Exceptional 20.3% |
| Immigrants | Japan | 100.0 /100 | #25 | Exceptional 20.0% |