Bahamian vs Immigrants from El Salvador Per Capita Income
COMPARE
Bahamian
Immigrants from El Salvador
Per Capita Income
Per Capita Income Comparison
Bahamians
Immigrants from El Salvador
$36,427
PER CAPITA INCOME
0.0/ 100
METRIC RATING
313th/ 347
METRIC RANK
$38,394
PER CAPITA INCOME
0.3/ 100
METRIC RATING
274th/ 347
METRIC RANK
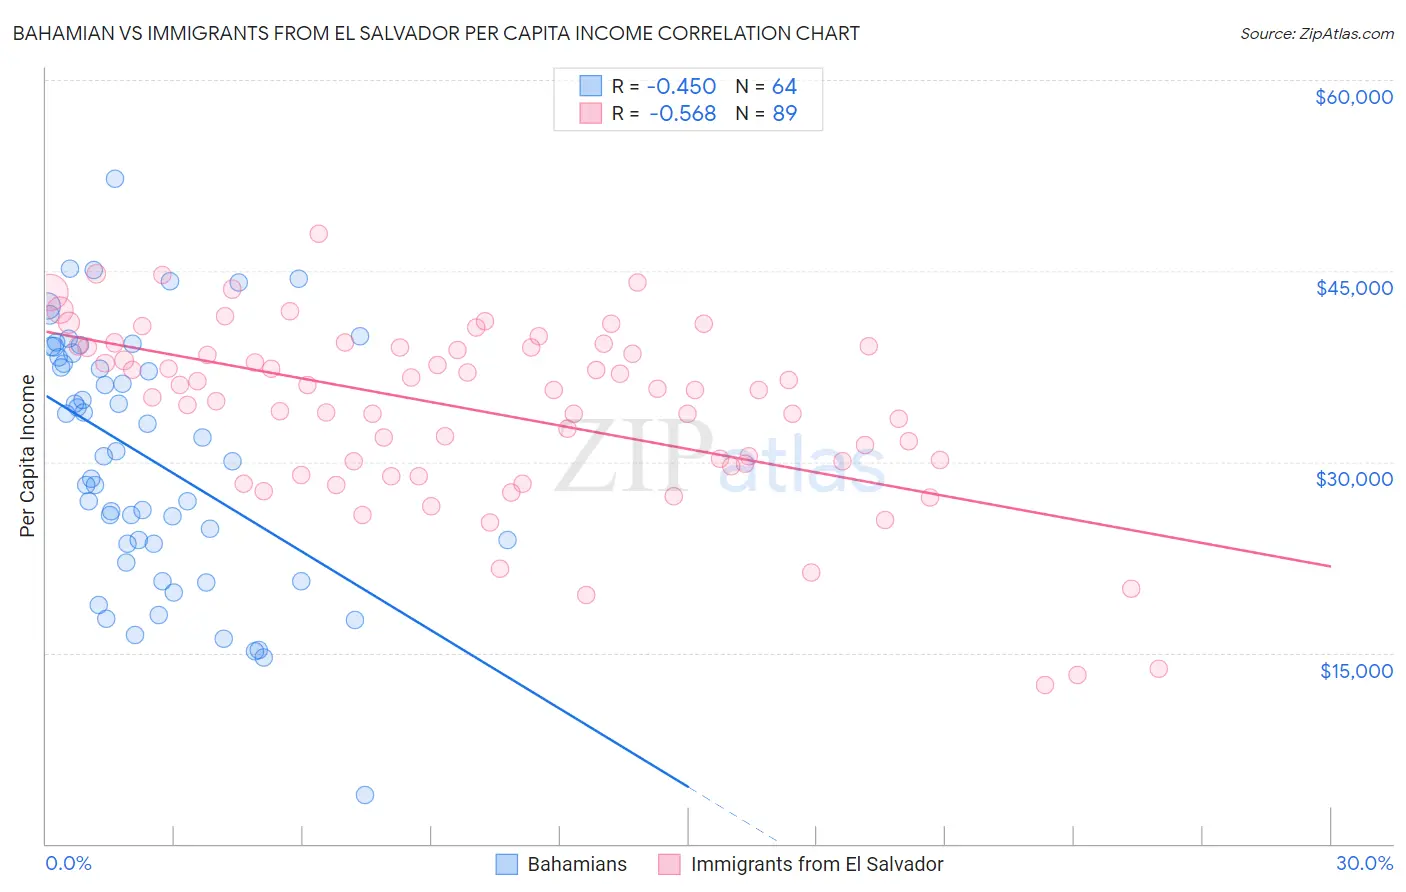
Bahamian vs Immigrants from El Salvador Per Capita Income Correlation Chart
The statistical analysis conducted on geographies consisting of 112,707,980 people shows a moderate negative correlation between the proportion of Bahamians and per capita income in the United States with a correlation coefficient (R) of -0.450 and weighted average of $36,427. Similarly, the statistical analysis conducted on geographies consisting of 357,847,435 people shows a substantial negative correlation between the proportion of Immigrants from El Salvador and per capita income in the United States with a correlation coefficient (R) of -0.568 and weighted average of $38,394, a difference of 5.4%.
Per Capita Income Correlation Summary
| Measurement | Bahamian | Immigrants from El Salvador |
| Minimum | $3,864 | $12,473 |
| Maximum | $52,210 | $47,918 |
| Range | $48,346 | $35,445 |
| Mean | $30,310 | $33,959 |
| Median | $30,639 | $35,640 |
| Interquartile 25% (IQ1) | $23,571 | $29,770 |
| Interquartile 75% (IQ3) | $38,367 | $39,011 |
| Interquartile Range (IQR) | $14,797 | $9,240 |
| Standard Deviation (Sample) | $9,801 | $7,077 |
| Standard Deviation (Population) | $9,724 | $7,037 |
Similar Demographics by Per Capita Income
Demographics Similar to Bahamians by Per Capita Income
In terms of per capita income, the demographic groups most similar to Bahamians are Chickasaw ($36,475, a difference of 0.13%), Chippewa ($36,631, a difference of 0.56%), Ute ($36,651, a difference of 0.62%), Immigrants from Honduras ($36,665, a difference of 0.65%), and Seminole ($36,180, a difference of 0.68%).
| Demographics | Rating | Rank | Per Capita Income |
| Immigrants | Haiti | 0.0 /100 | #306 | Tragic $36,849 |
| Immigrants | Latin America | 0.0 /100 | #307 | Tragic $36,823 |
| Fijians | 0.0 /100 | #308 | Tragic $36,690 |
| Immigrants | Honduras | 0.0 /100 | #309 | Tragic $36,665 |
| Ute | 0.0 /100 | #310 | Tragic $36,651 |
| Chippewa | 0.0 /100 | #311 | Tragic $36,631 |
| Chickasaw | 0.0 /100 | #312 | Tragic $36,475 |
| Bahamians | 0.0 /100 | #313 | Tragic $36,427 |
| Seminole | 0.0 /100 | #314 | Tragic $36,180 |
| Yaqui | 0.0 /100 | #315 | Tragic $36,112 |
| Choctaw | 0.0 /100 | #316 | Tragic $35,999 |
| Dutch West Indians | 0.0 /100 | #317 | Tragic $35,922 |
| Bangladeshis | 0.0 /100 | #318 | Tragic $35,897 |
| Immigrants | Congo | 0.0 /100 | #319 | Tragic $35,720 |
| Hispanics or Latinos | 0.0 /100 | #320 | Tragic $35,688 |
Demographics Similar to Immigrants from El Salvador by Per Capita Income
In terms of per capita income, the demographic groups most similar to Immigrants from El Salvador are Nepalese ($38,442, a difference of 0.13%), Immigrants from Cabo Verde ($38,540, a difference of 0.38%), Central American ($38,560, a difference of 0.43%), Immigrants from Belize ($38,614, a difference of 0.57%), and Immigrants from Liberia ($38,165, a difference of 0.60%).
| Demographics | Rating | Rank | Per Capita Income |
| Immigrants | Zaire | 0.4 /100 | #267 | Tragic $38,848 |
| Liberians | 0.4 /100 | #268 | Tragic $38,780 |
| Immigrants | Jamaica | 0.4 /100 | #269 | Tragic $38,766 |
| Immigrants | Belize | 0.3 /100 | #270 | Tragic $38,614 |
| Central Americans | 0.3 /100 | #271 | Tragic $38,560 |
| Immigrants | Cabo Verde | 0.3 /100 | #272 | Tragic $38,540 |
| Nepalese | 0.3 /100 | #273 | Tragic $38,442 |
| Immigrants | El Salvador | 0.3 /100 | #274 | Tragic $38,394 |
| Immigrants | Liberia | 0.2 /100 | #275 | Tragic $38,165 |
| Hmong | 0.2 /100 | #276 | Tragic $38,120 |
| Comanche | 0.2 /100 | #277 | Tragic $38,088 |
| Immigrants | Nicaragua | 0.2 /100 | #278 | Tragic $38,065 |
| Colville | 0.2 /100 | #279 | Tragic $38,047 |
| Potawatomi | 0.2 /100 | #280 | Tragic $38,046 |
| Immigrants | Dominica | 0.2 /100 | #281 | Tragic $37,952 |