Assyrian/Chaldean/Syriac vs Norwegian In Labor Force | Age 20-64
COMPARE
Assyrian/Chaldean/Syriac
Norwegian
In Labor Force | Age 20-64
In Labor Force | Age 20-64 Comparison
Assyrians/Chaldeans/Syriacs
Norwegians
79.4%
IN LABOR FORCE | AGE 20-64
33.3/ 100
METRIC RATING
187th/ 347
METRIC RANK
81.0%
IN LABOR FORCE | AGE 20-64
100.0/ 100
METRIC RATING
17th/ 347
METRIC RANK
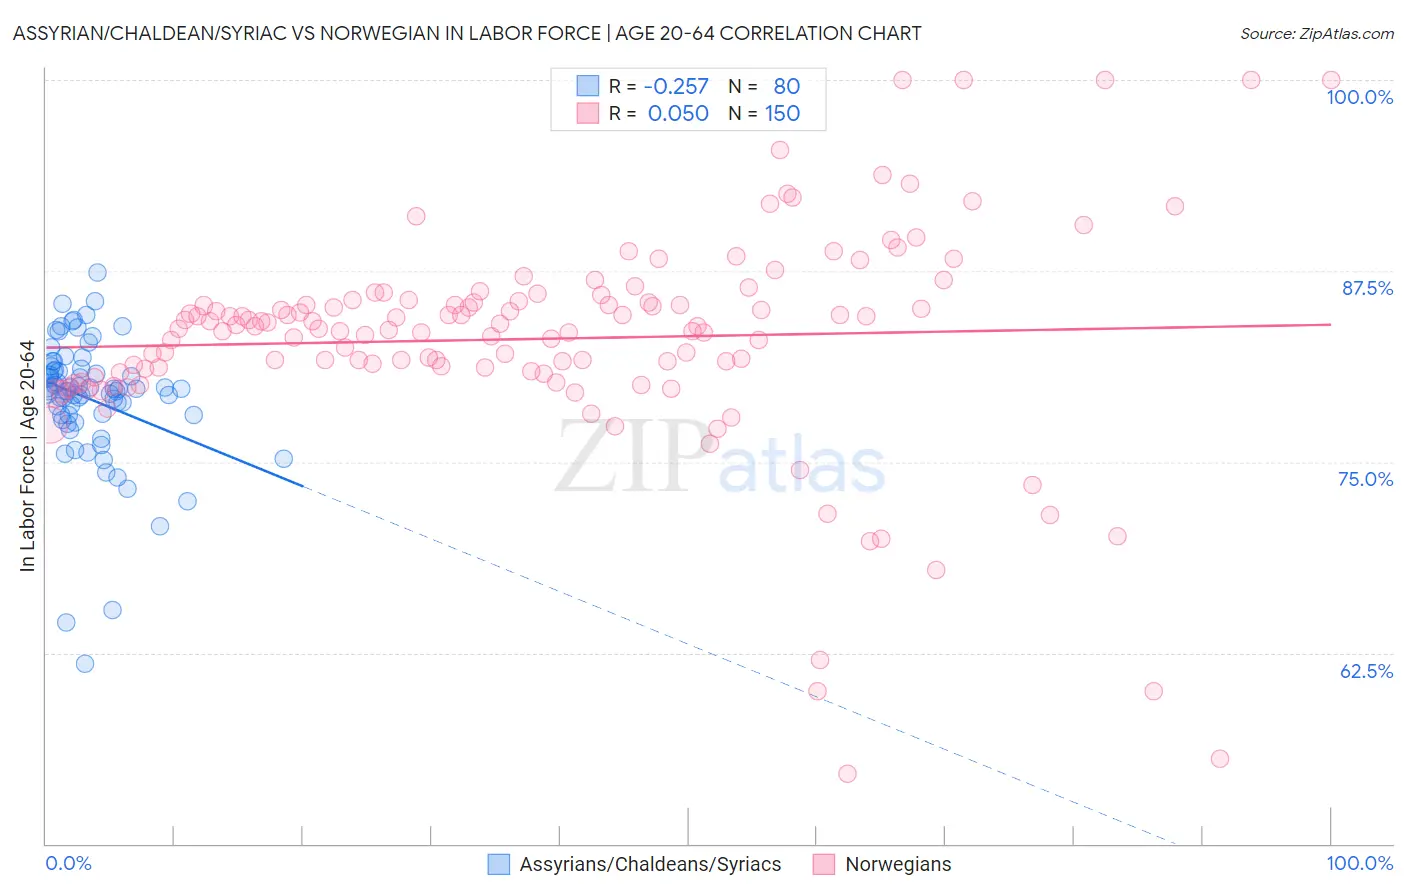
Assyrian/Chaldean/Syriac vs Norwegian In Labor Force | Age 20-64 Correlation Chart
The statistical analysis conducted on geographies consisting of 110,318,125 people shows a weak negative correlation between the proportion of Assyrians/Chaldeans/Syriacs and labor force participation rate among population between the ages 20 and 64 in the United States with a correlation coefficient (R) of -0.257 and weighted average of 79.4%. Similarly, the statistical analysis conducted on geographies consisting of 533,390,908 people shows no correlation between the proportion of Norwegians and labor force participation rate among population between the ages 20 and 64 in the United States with a correlation coefficient (R) of 0.050 and weighted average of 81.0%, a difference of 1.9%.
In Labor Force | Age 20-64 Correlation Summary
| Measurement | Assyrian/Chaldean/Syriac | Norwegian |
| Minimum | 61.8% | 54.6% |
| Maximum | 87.4% | 100.0% |
| Range | 25.6% | 45.4% |
| Mean | 79.1% | 83.1% |
| Median | 79.7% | 83.8% |
| Interquartile 25% (IQ1) | 78.1% | 80.9% |
| Interquartile 75% (IQ3) | 81.0% | 85.6% |
| Interquartile Range (IQR) | 2.9% | 4.6% |
| Standard Deviation (Sample) | 4.3% | 7.1% |
| Standard Deviation (Population) | 4.3% | 7.1% |
Similar Demographics by In Labor Force | Age 20-64
Demographics Similar to Assyrians/Chaldeans/Syriacs by In Labor Force | Age 20-64
In terms of in labor force | age 20-64, the demographic groups most similar to Assyrians/Chaldeans/Syriacs are Israeli (79.5%, a difference of 0.010%), Northern European (79.5%, a difference of 0.010%), Immigrants from Haiti (79.4%, a difference of 0.010%), Finnish (79.5%, a difference of 0.020%), and Immigrants from El Salvador (79.4%, a difference of 0.020%).
| Demographics | Rating | Rank | In Labor Force | Age 20-64 |
| Salvadorans | 41.0 /100 | #180 | Average 79.5% |
| Immigrants | Saudi Arabia | 37.7 /100 | #181 | Fair 79.5% |
| Malaysians | 37.1 /100 | #182 | Fair 79.5% |
| Immigrants | Hungary | 36.8 /100 | #183 | Fair 79.5% |
| Finns | 35.9 /100 | #184 | Fair 79.5% |
| Israelis | 34.7 /100 | #185 | Fair 79.5% |
| Northern Europeans | 34.5 /100 | #186 | Fair 79.5% |
| Assyrians/Chaldeans/Syriacs | 33.3 /100 | #187 | Fair 79.4% |
| Immigrants | Haiti | 32.1 /100 | #188 | Fair 79.4% |
| Immigrants | El Salvador | 30.9 /100 | #189 | Fair 79.4% |
| Immigrants | Syria | 30.8 /100 | #190 | Fair 79.4% |
| Swiss | 28.9 /100 | #191 | Fair 79.4% |
| Immigrants | Denmark | 26.9 /100 | #192 | Fair 79.4% |
| Indonesians | 26.1 /100 | #193 | Fair 79.4% |
| Immigrants | Thailand | 24.8 /100 | #194 | Fair 79.4% |
Demographics Similar to Norwegians by In Labor Force | Age 20-64
In terms of in labor force | age 20-64, the demographic groups most similar to Norwegians are Immigrants from Bulgaria (81.0%, a difference of 0.010%), Zimbabwean (81.0%, a difference of 0.020%), Thai (80.9%, a difference of 0.070%), Liberian (80.9%, a difference of 0.080%), and Bulgarian (81.1%, a difference of 0.11%).
| Demographics | Rating | Rank | In Labor Force | Age 20-64 |
| Immigrants | Sierra Leone | 100.0 /100 | #10 | Exceptional 81.5% |
| Immigrants | Eastern Africa | 100.0 /100 | #11 | Exceptional 81.3% |
| Immigrants | Eritrea | 100.0 /100 | #12 | Exceptional 81.3% |
| Immigrants | India | 100.0 /100 | #13 | Exceptional 81.3% |
| Cambodians | 100.0 /100 | #14 | Exceptional 81.1% |
| Bulgarians | 100.0 /100 | #15 | Exceptional 81.1% |
| Immigrants | Nepal | 100.0 /100 | #16 | Exceptional 81.1% |
| Norwegians | 100.0 /100 | #17 | Exceptional 81.0% |
| Immigrants | Bulgaria | 100.0 /100 | #18 | Exceptional 81.0% |
| Zimbabweans | 100.0 /100 | #19 | Exceptional 81.0% |
| Thais | 100.0 /100 | #20 | Exceptional 80.9% |
| Liberians | 100.0 /100 | #21 | Exceptional 80.9% |
| Sudanese | 100.0 /100 | #22 | Exceptional 80.8% |
| Immigrants | Bosnia and Herzegovina | 100.0 /100 | #23 | Exceptional 80.8% |
| Immigrants | Morocco | 100.0 /100 | #24 | Exceptional 80.8% |