Assyrian/Chaldean/Syriac vs Mongolian Single Mother Households
COMPARE
Assyrian/Chaldean/Syriac
Mongolian
Single Mother Households
Single Mother Households Comparison
Assyrians/Chaldeans/Syriacs
Mongolians
4.8%
SINGLE MOTHER HOUSEHOLDS
100.0/ 100
METRIC RATING
4th/ 347
METRIC RANK
5.8%
SINGLE MOTHER HOUSEHOLDS
95.3/ 100
METRIC RATING
113th/ 347
METRIC RANK
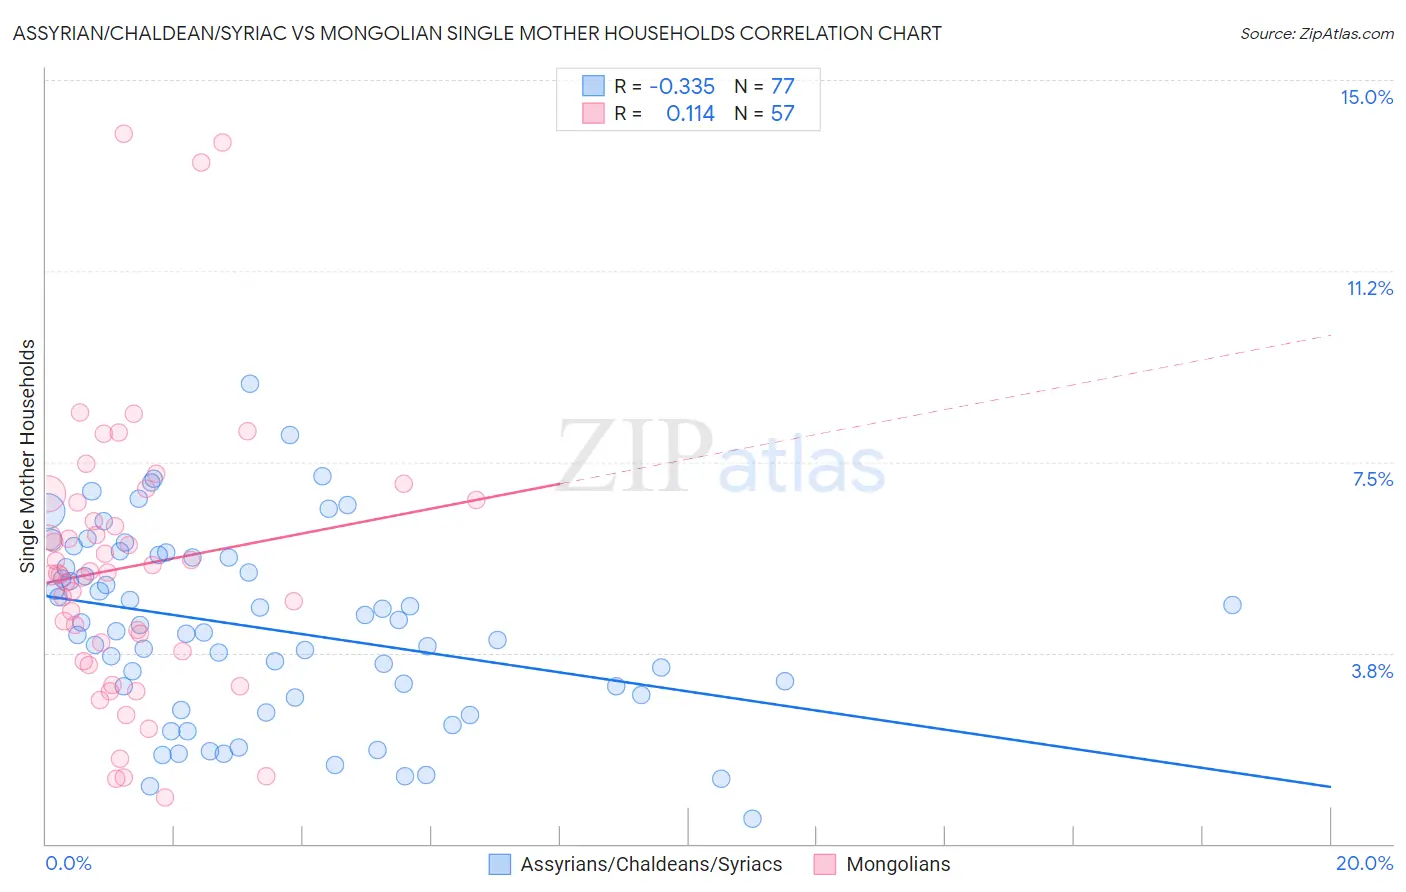
Assyrian/Chaldean/Syriac vs Mongolian Single Mother Households Correlation Chart
The statistical analysis conducted on geographies consisting of 110,241,669 people shows a mild negative correlation between the proportion of Assyrians/Chaldeans/Syriacs and percentage of single mother households in the United States with a correlation coefficient (R) of -0.335 and weighted average of 4.8%. Similarly, the statistical analysis conducted on geographies consisting of 140,225,354 people shows a poor positive correlation between the proportion of Mongolians and percentage of single mother households in the United States with a correlation coefficient (R) of 0.114 and weighted average of 5.8%, a difference of 20.4%.
Single Mother Households Correlation Summary
| Measurement | Assyrian/Chaldean/Syriac | Mongolian |
| Minimum | 0.50% | 0.92% |
| Maximum | 9.0% | 14.0% |
| Range | 8.5% | 13.0% |
| Mean | 4.2% | 5.4% |
| Median | 4.2% | 5.3% |
| Interquartile 25% (IQ1) | 2.9% | 3.7% |
| Interquartile 75% (IQ3) | 5.6% | 6.7% |
| Interquartile Range (IQR) | 2.7% | 3.0% |
| Standard Deviation (Sample) | 1.8% | 2.7% |
| Standard Deviation (Population) | 1.8% | 2.7% |
Similar Demographics by Single Mother Households
Demographics Similar to Assyrians/Chaldeans/Syriacs by Single Mother Households
In terms of single mother households, the demographic groups most similar to Assyrians/Chaldeans/Syriacs are Immigrants from Iran (4.8%, a difference of 0.080%), Immigrants from Hong Kong (4.8%, a difference of 0.52%), Filipino (4.7%, a difference of 2.4%), Immigrants from Taiwan (4.7%, a difference of 2.7%), and Immigrants from Singapore (5.0%, a difference of 3.1%).
| Demographics | Rating | Rank | Single Mother Households |
| Immigrants | Taiwan | 100.0 /100 | #1 | Exceptional 4.7% |
| Filipinos | 100.0 /100 | #2 | Exceptional 4.7% |
| Immigrants | Iran | 100.0 /100 | #3 | Exceptional 4.8% |
| Assyrians/Chaldeans/Syriacs | 100.0 /100 | #4 | Exceptional 4.8% |
| Immigrants | Hong Kong | 100.0 /100 | #5 | Exceptional 4.8% |
| Immigrants | Singapore | 100.0 /100 | #6 | Exceptional 5.0% |
| Iranians | 100.0 /100 | #7 | Exceptional 5.0% |
| Immigrants | Ireland | 99.9 /100 | #8 | Exceptional 5.0% |
| Okinawans | 99.9 /100 | #9 | Exceptional 5.0% |
| Immigrants | Israel | 99.9 /100 | #10 | Exceptional 5.0% |
| Immigrants | China | 99.9 /100 | #11 | Exceptional 5.1% |
| Cypriots | 99.9 /100 | #12 | Exceptional 5.1% |
| Immigrants | India | 99.9 /100 | #13 | Exceptional 5.1% |
| Immigrants | Australia | 99.9 /100 | #14 | Exceptional 5.1% |
| Immigrants | Eastern Asia | 99.9 /100 | #15 | Exceptional 5.1% |
Demographics Similar to Mongolians by Single Mother Households
In terms of single mother households, the demographic groups most similar to Mongolians are Immigrants from Kuwait (5.8%, a difference of 0.070%), Immigrants from England (5.8%, a difference of 0.11%), Dutch (5.8%, a difference of 0.13%), British (5.8%, a difference of 0.14%), and Immigrants from Western Europe (5.8%, a difference of 0.23%).
| Demographics | Rating | Rank | Single Mother Households |
| Immigrants | Ukraine | 95.9 /100 | #106 | Exceptional 5.8% |
| Paraguayans | 95.8 /100 | #107 | Exceptional 5.8% |
| Immigrants | Italy | 95.8 /100 | #108 | Exceptional 5.8% |
| Immigrants | Western Europe | 95.7 /100 | #109 | Exceptional 5.8% |
| British | 95.5 /100 | #110 | Exceptional 5.8% |
| Immigrants | England | 95.5 /100 | #111 | Exceptional 5.8% |
| Immigrants | Kuwait | 95.4 /100 | #112 | Exceptional 5.8% |
| Mongolians | 95.3 /100 | #113 | Exceptional 5.8% |
| Dutch | 95.1 /100 | #114 | Exceptional 5.8% |
| Irish | 94.8 /100 | #115 | Exceptional 5.8% |
| Pennsylvania Germans | 94.7 /100 | #116 | Exceptional 5.8% |
| Bolivians | 94.6 /100 | #117 | Exceptional 5.8% |
| Laotians | 94.3 /100 | #118 | Exceptional 5.8% |
| South Africans | 94.1 /100 | #119 | Exceptional 5.8% |
| Tongans | 93.7 /100 | #120 | Exceptional 5.8% |