Ethiopian vs Mongolian Median Male Earnings
COMPARE
Ethiopian
Mongolian
Median Male Earnings
Median Male Earnings Comparison
Ethiopians
Mongolians
$56,243
MEDIAN MALE EARNINGS
84.8/ 100
METRIC RATING
142nd/ 347
METRIC RANK
$60,350
MEDIAN MALE EARNINGS
99.7/ 100
METRIC RATING
71st/ 347
METRIC RANK
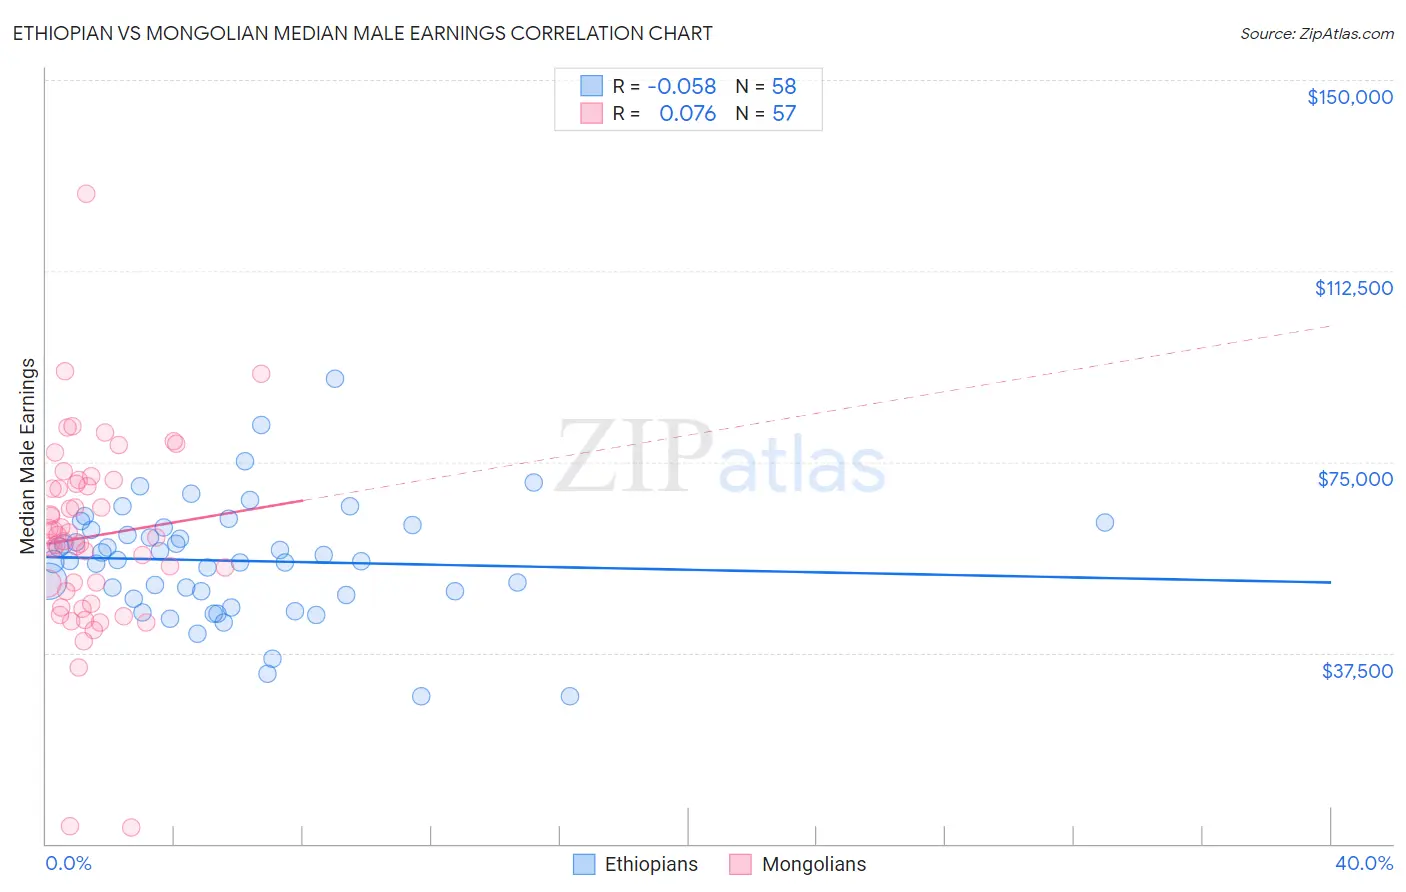
Ethiopian vs Mongolian Median Male Earnings Correlation Chart
The statistical analysis conducted on geographies consisting of 223,246,505 people shows a slight negative correlation between the proportion of Ethiopians and median male earnings in the United States with a correlation coefficient (R) of -0.058 and weighted average of $56,243. Similarly, the statistical analysis conducted on geographies consisting of 140,336,104 people shows a slight positive correlation between the proportion of Mongolians and median male earnings in the United States with a correlation coefficient (R) of 0.076 and weighted average of $60,350, a difference of 7.3%.
Median Male Earnings Correlation Summary
| Measurement | Ethiopian | Mongolian |
| Minimum | $28,882 | $3,109 |
| Maximum | $91,333 | $127,545 |
| Range | $62,451 | $124,436 |
| Mean | $55,598 | $60,323 |
| Median | $55,634 | $60,102 |
| Interquartile 25% (IQ1) | $48,793 | $48,308 |
| Interquartile 75% (IQ3) | $62,132 | $71,104 |
| Interquartile Range (IQR) | $13,339 | $22,796 |
| Standard Deviation (Sample) | $11,505 | $19,294 |
| Standard Deviation (Population) | $11,405 | $19,124 |
Similar Demographics by Median Male Earnings
Demographics Similar to Ethiopians by Median Male Earnings
In terms of median male earnings, the demographic groups most similar to Ethiopians are Danish ($56,246, a difference of 0.0%), Zimbabwean ($56,302, a difference of 0.10%), Luxembourger ($56,300, a difference of 0.10%), Slovak ($56,306, a difference of 0.11%), and Sri Lankan ($56,136, a difference of 0.19%).
| Demographics | Rating | Rank | Median Male Earnings |
| Irish | 87.4 /100 | #135 | Excellent $56,464 |
| Immigrants | Saudi Arabia | 87.2 /100 | #136 | Excellent $56,452 |
| Slavs | 86.5 /100 | #137 | Excellent $56,390 |
| Slovaks | 85.5 /100 | #138 | Excellent $56,306 |
| Zimbabweans | 85.5 /100 | #139 | Excellent $56,302 |
| Luxembourgers | 85.5 /100 | #140 | Excellent $56,300 |
| Danes | 84.8 /100 | #141 | Excellent $56,246 |
| Ethiopians | 84.8 /100 | #142 | Excellent $56,243 |
| Sri Lankans | 83.4 /100 | #143 | Excellent $56,136 |
| Immigrants | Uganda | 82.4 /100 | #144 | Excellent $56,064 |
| Norwegians | 80.9 /100 | #145 | Excellent $55,965 |
| Immigrants | Chile | 80.7 /100 | #146 | Excellent $55,954 |
| Immigrants | Philippines | 78.4 /100 | #147 | Good $55,809 |
| Scottish | 78.2 /100 | #148 | Good $55,793 |
| English | 77.4 /100 | #149 | Good $55,747 |
Demographics Similar to Mongolians by Median Male Earnings
In terms of median male earnings, the demographic groups most similar to Mongolians are Immigrants from Bulgaria ($60,358, a difference of 0.010%), Immigrants from Western Europe ($60,334, a difference of 0.030%), Immigrants from Canada ($60,388, a difference of 0.060%), Immigrants from North America ($60,265, a difference of 0.14%), and Argentinean ($60,117, a difference of 0.39%).
| Demographics | Rating | Rank | Median Male Earnings |
| Immigrants | Eastern Europe | 99.8 /100 | #64 | Exceptional $60,958 |
| Immigrants | Indonesia | 99.8 /100 | #65 | Exceptional $60,935 |
| Immigrants | Croatia | 99.8 /100 | #66 | Exceptional $60,914 |
| Immigrants | Spain | 99.8 /100 | #67 | Exceptional $60,750 |
| Immigrants | Serbia | 99.7 /100 | #68 | Exceptional $60,600 |
| Immigrants | Canada | 99.7 /100 | #69 | Exceptional $60,388 |
| Immigrants | Bulgaria | 99.7 /100 | #70 | Exceptional $60,358 |
| Mongolians | 99.7 /100 | #71 | Exceptional $60,350 |
| Immigrants | Western Europe | 99.7 /100 | #72 | Exceptional $60,334 |
| Immigrants | North America | 99.7 /100 | #73 | Exceptional $60,265 |
| Argentineans | 99.6 /100 | #74 | Exceptional $60,117 |
| Immigrants | Bolivia | 99.6 /100 | #75 | Exceptional $60,088 |
| Romanians | 99.6 /100 | #76 | Exceptional $60,063 |
| Paraguayans | 99.5 /100 | #77 | Exceptional $59,975 |
| Immigrants | Egypt | 99.5 /100 | #78 | Exceptional $59,925 |