Assyrian/Chaldean/Syriac vs Mongolian Unemployment
COMPARE
Assyrian/Chaldean/Syriac
Mongolian
Unemployment
Unemployment Comparison
Assyrians/Chaldeans/Syriacs
Mongolians
5.3%
UNEMPLOYMENT
39.2/ 100
METRIC RATING
184th/ 347
METRIC RANK
5.0%
UNEMPLOYMENT
94.8/ 100
METRIC RATING
99th/ 347
METRIC RANK
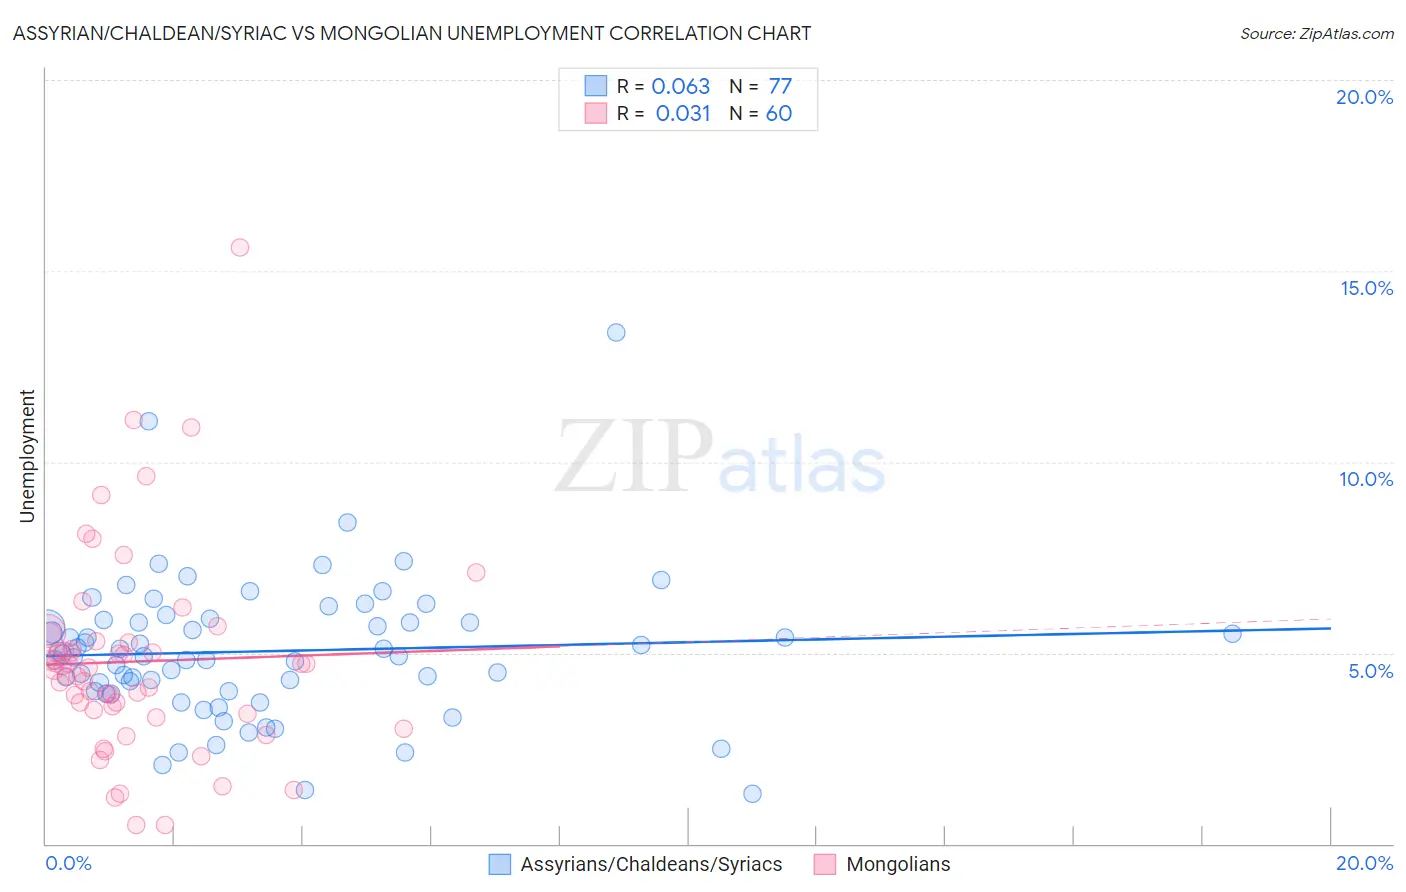
Assyrian/Chaldean/Syriac vs Mongolian Unemployment Correlation Chart
The statistical analysis conducted on geographies consisting of 110,292,838 people shows a slight positive correlation between the proportion of Assyrians/Chaldeans/Syriacs and unemployment in the United States with a correlation coefficient (R) of 0.063 and weighted average of 5.3%. Similarly, the statistical analysis conducted on geographies consisting of 140,354,726 people shows no correlation between the proportion of Mongolians and unemployment in the United States with a correlation coefficient (R) of 0.031 and weighted average of 5.0%, a difference of 5.4%.
Unemployment Correlation Summary
| Measurement | Assyrian/Chaldean/Syriac | Mongolian |
| Minimum | 1.3% | 0.50% |
| Maximum | 13.4% | 15.6% |
| Range | 12.1% | 15.1% |
| Mean | 5.0% | 4.8% |
| Median | 4.9% | 4.6% |
| Interquartile 25% (IQ1) | 4.0% | 3.5% |
| Interquartile 75% (IQ3) | 5.8% | 5.3% |
| Interquartile Range (IQR) | 1.8% | 1.8% |
| Standard Deviation (Sample) | 1.9% | 2.6% |
| Standard Deviation (Population) | 1.8% | 2.6% |
Similar Demographics by Unemployment
Demographics Similar to Assyrians/Chaldeans/Syriacs by Unemployment
In terms of unemployment, the demographic groups most similar to Assyrians/Chaldeans/Syriacs are Immigrants from Thailand (5.3%, a difference of 0.020%), Brazilian (5.3%, a difference of 0.060%), Immigrants from Uganda (5.3%, a difference of 0.090%), Costa Rican (5.3%, a difference of 0.12%), and Alsatian (5.3%, a difference of 0.14%).
| Demographics | Rating | Rank | Unemployment |
| Immigrants | Nonimmigrants | 47.9 /100 | #177 | Average 5.3% |
| Afghans | 47.4 /100 | #178 | Average 5.3% |
| Malaysians | 46.8 /100 | #179 | Average 5.3% |
| Immigrants | Greece | 45.0 /100 | #180 | Average 5.3% |
| Albanians | 43.5 /100 | #181 | Average 5.3% |
| Spaniards | 42.2 /100 | #182 | Average 5.3% |
| Brazilians | 40.2 /100 | #183 | Average 5.3% |
| Assyrians/Chaldeans/Syriacs | 39.2 /100 | #184 | Fair 5.3% |
| Immigrants | Thailand | 38.9 /100 | #185 | Fair 5.3% |
| Immigrants | Uganda | 37.8 /100 | #186 | Fair 5.3% |
| Costa Ricans | 37.4 /100 | #187 | Fair 5.3% |
| Alsatians | 37.0 /100 | #188 | Fair 5.3% |
| Immigrants | Belarus | 35.6 /100 | #189 | Fair 5.3% |
| Arabs | 35.3 /100 | #190 | Fair 5.3% |
| Somalis | 34.0 /100 | #191 | Fair 5.3% |
Demographics Similar to Mongolians by Unemployment
In terms of unemployment, the demographic groups most similar to Mongolians are Estonian (5.0%, a difference of 0.060%), Romanian (5.0%, a difference of 0.070%), Immigrants from Czechoslovakia (5.0%, a difference of 0.10%), Immigrants from England (5.0%, a difference of 0.13%), and American (5.0%, a difference of 0.15%).
| Demographics | Rating | Rank | Unemployment |
| Immigrants | South Africa | 96.2 /100 | #92 | Exceptional 5.0% |
| Ukrainians | 96.0 /100 | #93 | Exceptional 5.0% |
| Immigrants | Austria | 95.9 /100 | #94 | Exceptional 5.0% |
| Immigrants | Serbia | 95.6 /100 | #95 | Exceptional 5.0% |
| Immigrants | England | 95.2 /100 | #96 | Exceptional 5.0% |
| Immigrants | Czechoslovakia | 95.1 /100 | #97 | Exceptional 5.0% |
| Romanians | 95.0 /100 | #98 | Exceptional 5.0% |
| Mongolians | 94.8 /100 | #99 | Exceptional 5.0% |
| Estonians | 94.6 /100 | #100 | Exceptional 5.0% |
| Americans | 94.3 /100 | #101 | Exceptional 5.0% |
| Immigrants | Argentina | 94.1 /100 | #102 | Exceptional 5.0% |
| Chickasaw | 94.0 /100 | #103 | Exceptional 5.0% |
| Osage | 94.0 /100 | #104 | Exceptional 5.0% |
| Maltese | 94.0 /100 | #105 | Exceptional 5.0% |
| Immigrants | Romania | 93.7 /100 | #106 | Exceptional 5.0% |