Assyrian/Chaldean/Syriac vs Mongolian Male Disability
COMPARE
Assyrian/Chaldean/Syriac
Mongolian
Male Disability
Male Disability Comparison
Assyrians/Chaldeans/Syriacs
Mongolians
11.4%
MALE DISABILITY
23.2/ 100
METRIC RATING
192nd/ 347
METRIC RANK
10.3%
MALE DISABILITY
99.7/ 100
METRIC RATING
42nd/ 347
METRIC RANK
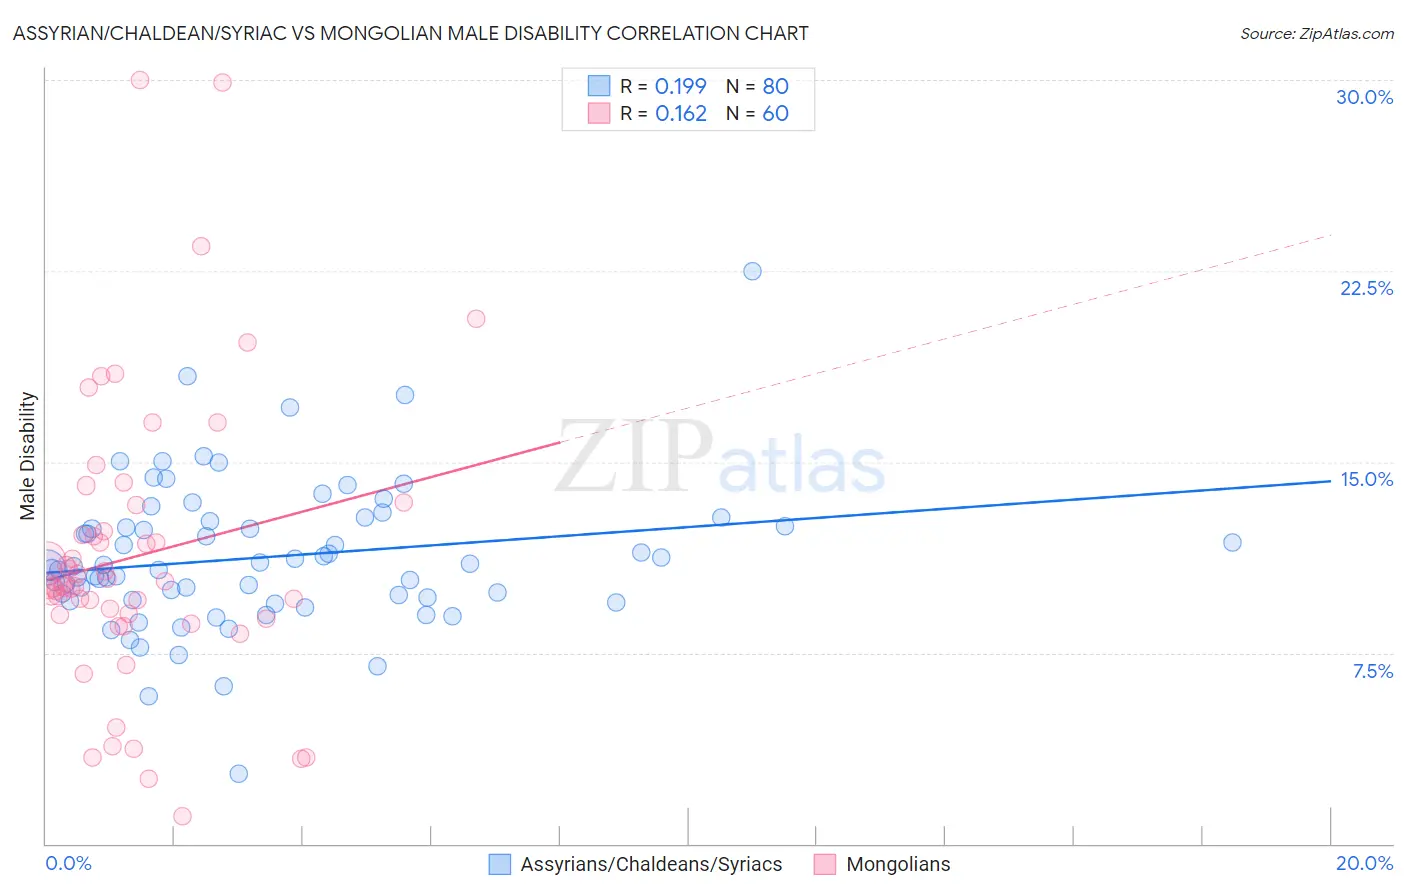
Assyrian/Chaldean/Syriac vs Mongolian Male Disability Correlation Chart
The statistical analysis conducted on geographies consisting of 110,312,508 people shows a poor positive correlation between the proportion of Assyrians/Chaldeans/Syriacs and percentage of males with a disability in the United States with a correlation coefficient (R) of 0.199 and weighted average of 11.4%. Similarly, the statistical analysis conducted on geographies consisting of 140,361,312 people shows a poor positive correlation between the proportion of Mongolians and percentage of males with a disability in the United States with a correlation coefficient (R) of 0.162 and weighted average of 10.3%, a difference of 10.8%.
Male Disability Correlation Summary
| Measurement | Assyrian/Chaldean/Syriac | Mongolian |
| Minimum | 2.8% | 1.1% |
| Maximum | 22.5% | 30.0% |
| Range | 19.7% | 28.9% |
| Mean | 11.3% | 11.3% |
| Median | 10.9% | 10.1% |
| Interquartile 25% (IQ1) | 9.6% | 8.9% |
| Interquartile 75% (IQ3) | 12.6% | 12.8% |
| Interquartile Range (IQR) | 3.0% | 3.9% |
| Standard Deviation (Sample) | 2.9% | 5.7% |
| Standard Deviation (Population) | 2.9% | 5.6% |
Similar Demographics by Male Disability
Demographics Similar to Assyrians/Chaldeans/Syriacs by Male Disability
In terms of male disability, the demographic groups most similar to Assyrians/Chaldeans/Syriacs are Senegalese (11.4%, a difference of 0.0%), Greek (11.4%, a difference of 0.070%), Belizean (11.4%, a difference of 0.15%), Immigrants from Bosnia and Herzegovina (11.4%, a difference of 0.16%), and Immigrants from Oceania (11.4%, a difference of 0.18%).
| Demographics | Rating | Rank | Male Disability |
| Pakistanis | 30.3 /100 | #185 | Fair 11.3% |
| Immigrants | Zaire | 27.6 /100 | #186 | Fair 11.4% |
| Immigrants | Austria | 27.3 /100 | #187 | Fair 11.4% |
| Estonians | 26.8 /100 | #188 | Fair 11.4% |
| Immigrants | Netherlands | 25.9 /100 | #189 | Fair 11.4% |
| Immigrants | Bosnia and Herzegovina | 25.4 /100 | #190 | Fair 11.4% |
| Senegalese | 23.2 /100 | #191 | Fair 11.4% |
| Assyrians/Chaldeans/Syriacs | 23.2 /100 | #192 | Fair 11.4% |
| Greeks | 22.2 /100 | #193 | Fair 11.4% |
| Belizeans | 21.2 /100 | #194 | Fair 11.4% |
| Immigrants | Oceania | 20.9 /100 | #195 | Fair 11.4% |
| West Indians | 18.4 /100 | #196 | Poor 11.4% |
| Somalis | 18.2 /100 | #197 | Poor 11.4% |
| Immigrants | Jamaica | 16.3 /100 | #198 | Poor 11.5% |
| Lebanese | 15.4 /100 | #199 | Poor 11.5% |
Demographics Similar to Mongolians by Male Disability
In terms of male disability, the demographic groups most similar to Mongolians are Immigrants from Bangladesh (10.3%, a difference of 0.020%), Immigrants from El Salvador (10.3%, a difference of 0.090%), Turkish (10.3%, a difference of 0.10%), Cambodian (10.3%, a difference of 0.18%), and Immigrants from Peru (10.3%, a difference of 0.22%).
| Demographics | Rating | Rank | Male Disability |
| Immigrants | Argentina | 99.9 /100 | #35 | Exceptional 10.2% |
| Ethiopians | 99.8 /100 | #36 | Exceptional 10.2% |
| Immigrants | Indonesia | 99.8 /100 | #37 | Exceptional 10.2% |
| Immigrants | Kuwait | 99.8 /100 | #38 | Exceptional 10.2% |
| Afghans | 99.8 /100 | #39 | Exceptional 10.2% |
| Immigrants | Nepal | 99.8 /100 | #40 | Exceptional 10.3% |
| Taiwanese | 99.8 /100 | #41 | Exceptional 10.3% |
| Mongolians | 99.7 /100 | #42 | Exceptional 10.3% |
| Immigrants | Bangladesh | 99.7 /100 | #43 | Exceptional 10.3% |
| Immigrants | El Salvador | 99.7 /100 | #44 | Exceptional 10.3% |
| Turks | 99.7 /100 | #45 | Exceptional 10.3% |
| Cambodians | 99.7 /100 | #46 | Exceptional 10.3% |
| Immigrants | Peru | 99.7 /100 | #47 | Exceptional 10.3% |
| Israelis | 99.7 /100 | #48 | Exceptional 10.3% |
| Immigrants | Spain | 99.7 /100 | #49 | Exceptional 10.3% |