Assyrian/Chaldean/Syriac vs Mongolian No Vehicles in Household
COMPARE
Assyrian/Chaldean/Syriac
Mongolian
No Vehicles in Household
No Vehicles in Household Comparison
Assyrians/Chaldeans/Syriacs
Mongolians
7.0%
NO VEHICLES IN HOUSEHOLD
100.0/ 100
METRIC RATING
12th/ 347
METRIC RANK
13.1%
NO VEHICLES IN HOUSEHOLD
0.0/ 100
METRIC RATING
279th/ 347
METRIC RANK
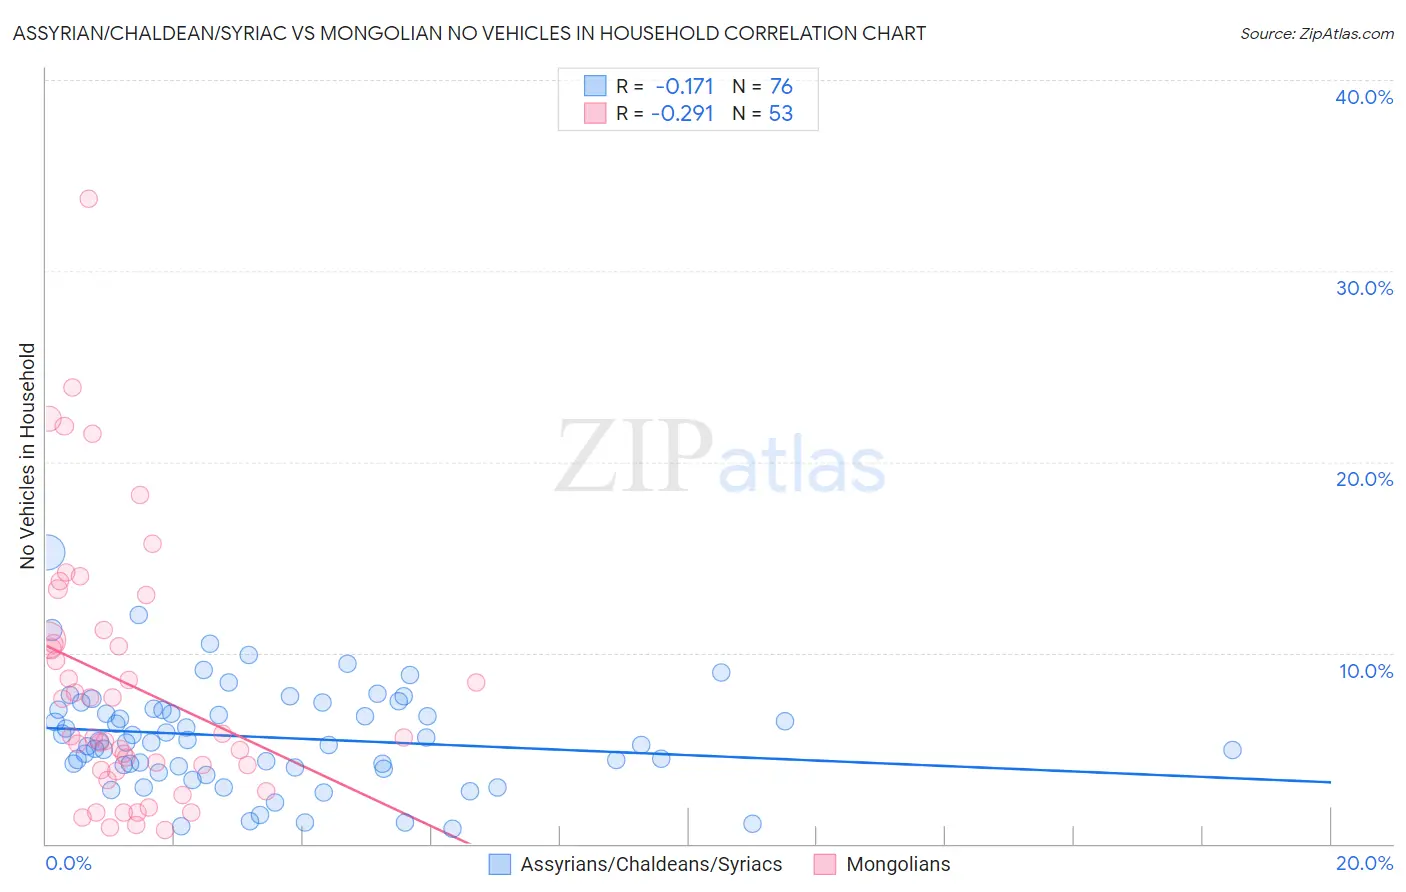
Assyrian/Chaldean/Syriac vs Mongolian No Vehicles in Household Correlation Chart
The statistical analysis conducted on geographies consisting of 110,265,900 people shows a poor negative correlation between the proportion of Assyrians/Chaldeans/Syriacs and percentage of households with no vehicle available in the United States with a correlation coefficient (R) of -0.171 and weighted average of 7.0%. Similarly, the statistical analysis conducted on geographies consisting of 140,111,412 people shows a weak negative correlation between the proportion of Mongolians and percentage of households with no vehicle available in the United States with a correlation coefficient (R) of -0.291 and weighted average of 13.1%, a difference of 88.0%.
No Vehicles in Household Correlation Summary
| Measurement | Assyrian/Chaldean/Syriac | Mongolian |
| Minimum | 0.78% | 0.73% |
| Maximum | 15.3% | 33.8% |
| Range | 14.5% | 33.1% |
| Mean | 5.6% | 8.4% |
| Median | 5.3% | 5.6% |
| Interquartile 25% (IQ1) | 4.0% | 3.8% |
| Interquartile 75% (IQ3) | 7.0% | 11.0% |
| Interquartile Range (IQR) | 3.0% | 7.1% |
| Standard Deviation (Sample) | 2.7% | 6.9% |
| Standard Deviation (Population) | 2.7% | 6.9% |
Similar Demographics by No Vehicles in Household
Demographics Similar to Assyrians/Chaldeans/Syriacs by No Vehicles in Household
In terms of no vehicles in household, the demographic groups most similar to Assyrians/Chaldeans/Syriacs are Scandinavian (7.0%, a difference of 0.50%), Mexican (7.0%, a difference of 0.67%), White/Caucasian (7.0%, a difference of 0.80%), Czech (6.9%, a difference of 1.4%), and European (7.1%, a difference of 2.0%).
| Demographics | Rating | Rank | No Vehicles in Household |
| Yakama | 100.0 /100 | #5 | Exceptional 6.6% |
| Germans | 100.0 /100 | #6 | Exceptional 6.7% |
| Scottish | 100.0 /100 | #7 | Exceptional 6.8% |
| Swedes | 100.0 /100 | #8 | Exceptional 6.8% |
| Scotch-Irish | 100.0 /100 | #9 | Exceptional 6.8% |
| Dutch | 100.0 /100 | #10 | Exceptional 6.8% |
| Czechs | 100.0 /100 | #11 | Exceptional 6.9% |
| Assyrians/Chaldeans/Syriacs | 100.0 /100 | #12 | Exceptional 7.0% |
| Scandinavians | 100.0 /100 | #13 | Exceptional 7.0% |
| Mexicans | 100.0 /100 | #14 | Exceptional 7.0% |
| Whites/Caucasians | 100.0 /100 | #15 | Exceptional 7.0% |
| Europeans | 100.0 /100 | #16 | Exceptional 7.1% |
| Welsh | 100.0 /100 | #17 | Exceptional 7.2% |
| Tongans | 100.0 /100 | #18 | Exceptional 7.2% |
| Arapaho | 100.0 /100 | #19 | Exceptional 7.4% |
Demographics Similar to Mongolians by No Vehicles in Household
In terms of no vehicles in household, the demographic groups most similar to Mongolians are Alsatian (13.2%, a difference of 0.27%), Immigrants from Croatia (13.0%, a difference of 0.69%), Aleut (13.0%, a difference of 0.73%), Immigrants from Southern Europe (13.0%, a difference of 0.81%), and Immigrants from Albania (13.0%, a difference of 1.2%).
| Demographics | Rating | Rank | No Vehicles in Household |
| Bermudans | 0.1 /100 | #272 | Tragic 12.8% |
| Immigrants | France | 0.1 /100 | #273 | Tragic 12.9% |
| Immigrants | Singapore | 0.1 /100 | #274 | Tragic 12.9% |
| Immigrants | Albania | 0.1 /100 | #275 | Tragic 13.0% |
| Immigrants | Southern Europe | 0.1 /100 | #276 | Tragic 13.0% |
| Aleuts | 0.1 /100 | #277 | Tragic 13.0% |
| Immigrants | Croatia | 0.1 /100 | #278 | Tragic 13.0% |
| Mongolians | 0.0 /100 | #279 | Tragic 13.1% |
| Alsatians | 0.0 /100 | #280 | Tragic 13.2% |
| Central American Indians | 0.0 /100 | #281 | Tragic 13.3% |
| Immigrants | Eastern Asia | 0.0 /100 | #282 | Tragic 13.5% |
| Immigrants | Kazakhstan | 0.0 /100 | #283 | Tragic 13.6% |
| Immigrants | Malaysia | 0.0 /100 | #284 | Tragic 13.6% |
| Immigrants | Eastern Europe | 0.0 /100 | #285 | Tragic 13.6% |
| Colville | 0.0 /100 | #286 | Tragic 13.7% |