Assyrian/Chaldean/Syriac vs Immigrants from Saudi Arabia Median Earnings
COMPARE
Assyrian/Chaldean/Syriac
Immigrants from Saudi Arabia
Median Earnings
Median Earnings Comparison
Assyrians/Chaldeans/Syriacs
Immigrants from Saudi Arabia
$48,304
MEDIAN EARNINGS
93.3/ 100
METRIC RATING
126th/ 347
METRIC RANK
$47,704
MEDIAN EARNINGS
85.6/ 100
METRIC RATING
145th/ 347
METRIC RANK
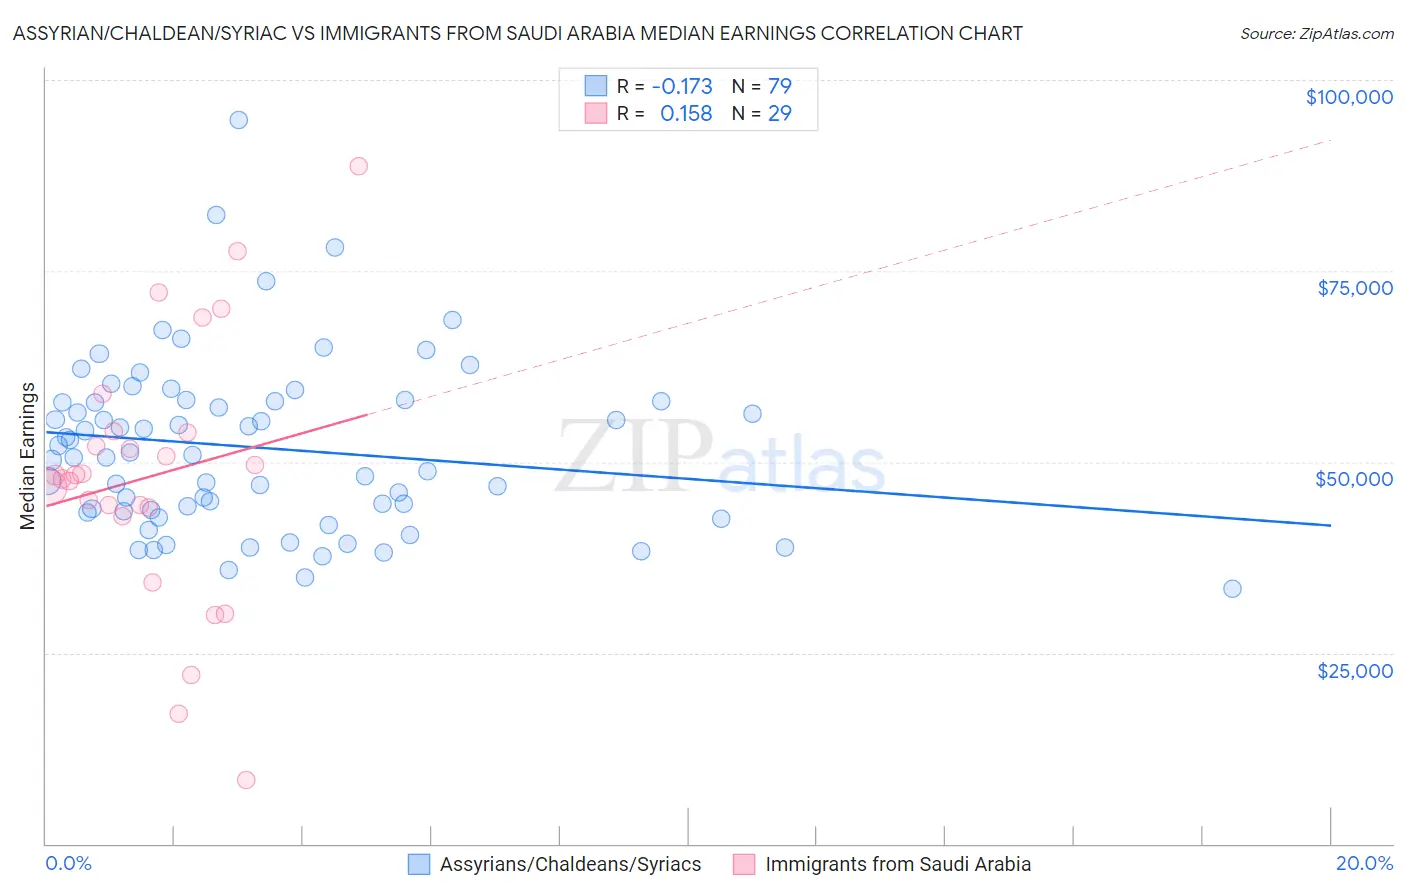
Assyrian/Chaldean/Syriac vs Immigrants from Saudi Arabia Median Earnings Correlation Chart
The statistical analysis conducted on geographies consisting of 110,275,669 people shows a poor negative correlation between the proportion of Assyrians/Chaldeans/Syriacs and median earnings in the United States with a correlation coefficient (R) of -0.173 and weighted average of $48,304. Similarly, the statistical analysis conducted on geographies consisting of 164,295,886 people shows a poor positive correlation between the proportion of Immigrants from Saudi Arabia and median earnings in the United States with a correlation coefficient (R) of 0.158 and weighted average of $47,704, a difference of 1.3%.
Median Earnings Correlation Summary
| Measurement | Assyrian/Chaldean/Syriac | Immigrants from Saudi Arabia |
| Minimum | $33,351 | $8,283 |
| Maximum | $94,792 | $88,678 |
| Range | $61,441 | $80,395 |
| Mean | $51,833 | $48,188 |
| Median | $50,898 | $48,225 |
| Interquartile 25% (IQ1) | $43,507 | $43,477 |
| Interquartile 75% (IQ3) | $57,898 | $53,983 |
| Interquartile Range (IQR) | $14,391 | $10,507 |
| Standard Deviation (Sample) | $11,326 | $17,307 |
| Standard Deviation (Population) | $11,254 | $17,006 |
Demographics Similar to Assyrians/Chaldeans/Syriacs and Immigrants from Saudi Arabia by Median Earnings
In terms of median earnings, the demographic groups most similar to Assyrians/Chaldeans/Syriacs are Immigrants from Fiji ($48,305, a difference of 0.0%), Sierra Leonean ($48,286, a difference of 0.040%), Immigrants from Philippines ($48,266, a difference of 0.080%), Pakistani ($48,254, a difference of 0.10%), and Zimbabwean ($48,229, a difference of 0.16%). Similarly, the demographic groups most similar to Immigrants from Saudi Arabia are Hungarian ($47,795, a difference of 0.19%), Ugandan ($47,854, a difference of 0.31%), Swedish ($47,851, a difference of 0.31%), Immigrants from Sierra Leone ($47,875, a difference of 0.36%), and Taiwanese ($47,902, a difference of 0.41%).
| Demographics | Rating | Rank | Median Earnings |
| Immigrants | Fiji | 93.3 /100 | #125 | Exceptional $48,305 |
| Assyrians/Chaldeans/Syriacs | 93.3 /100 | #126 | Exceptional $48,304 |
| Sierra Leoneans | 93.1 /100 | #127 | Exceptional $48,286 |
| Immigrants | Philippines | 92.9 /100 | #128 | Exceptional $48,266 |
| Pakistanis | 92.8 /100 | #129 | Exceptional $48,254 |
| Zimbabweans | 92.6 /100 | #130 | Exceptional $48,229 |
| Lebanese | 92.5 /100 | #131 | Exceptional $48,226 |
| British | 92.2 /100 | #132 | Exceptional $48,189 |
| Immigrants | Uganda | 90.5 /100 | #133 | Exceptional $48,041 |
| Sri Lankans | 90.5 /100 | #134 | Exceptional $48,040 |
| Portuguese | 90.4 /100 | #135 | Exceptional $48,032 |
| Slovenes | 90.0 /100 | #136 | Excellent $47,995 |
| Immigrants | Nepal | 89.0 /100 | #137 | Excellent $47,925 |
| Europeans | 88.9 /100 | #138 | Excellent $47,915 |
| Canadians | 88.8 /100 | #139 | Excellent $47,911 |
| Taiwanese | 88.7 /100 | #140 | Excellent $47,902 |
| Immigrants | Sierra Leone | 88.3 /100 | #141 | Excellent $47,875 |
| Ugandans | 88.0 /100 | #142 | Excellent $47,854 |
| Swedes | 88.0 /100 | #143 | Excellent $47,851 |
| Hungarians | 87.1 /100 | #144 | Excellent $47,795 |
| Immigrants | Saudi Arabia | 85.6 /100 | #145 | Excellent $47,704 |