Bulgarian vs Immigrants from Saudi Arabia Median Male Earnings
COMPARE
Bulgarian
Immigrants from Saudi Arabia
Median Male Earnings
Median Male Earnings Comparison
Bulgarians
Immigrants from Saudi Arabia
$62,378
MEDIAN MALE EARNINGS
100.0/ 100
METRIC RATING
45th/ 347
METRIC RANK
$56,452
MEDIAN MALE EARNINGS
87.2/ 100
METRIC RATING
136th/ 347
METRIC RANK
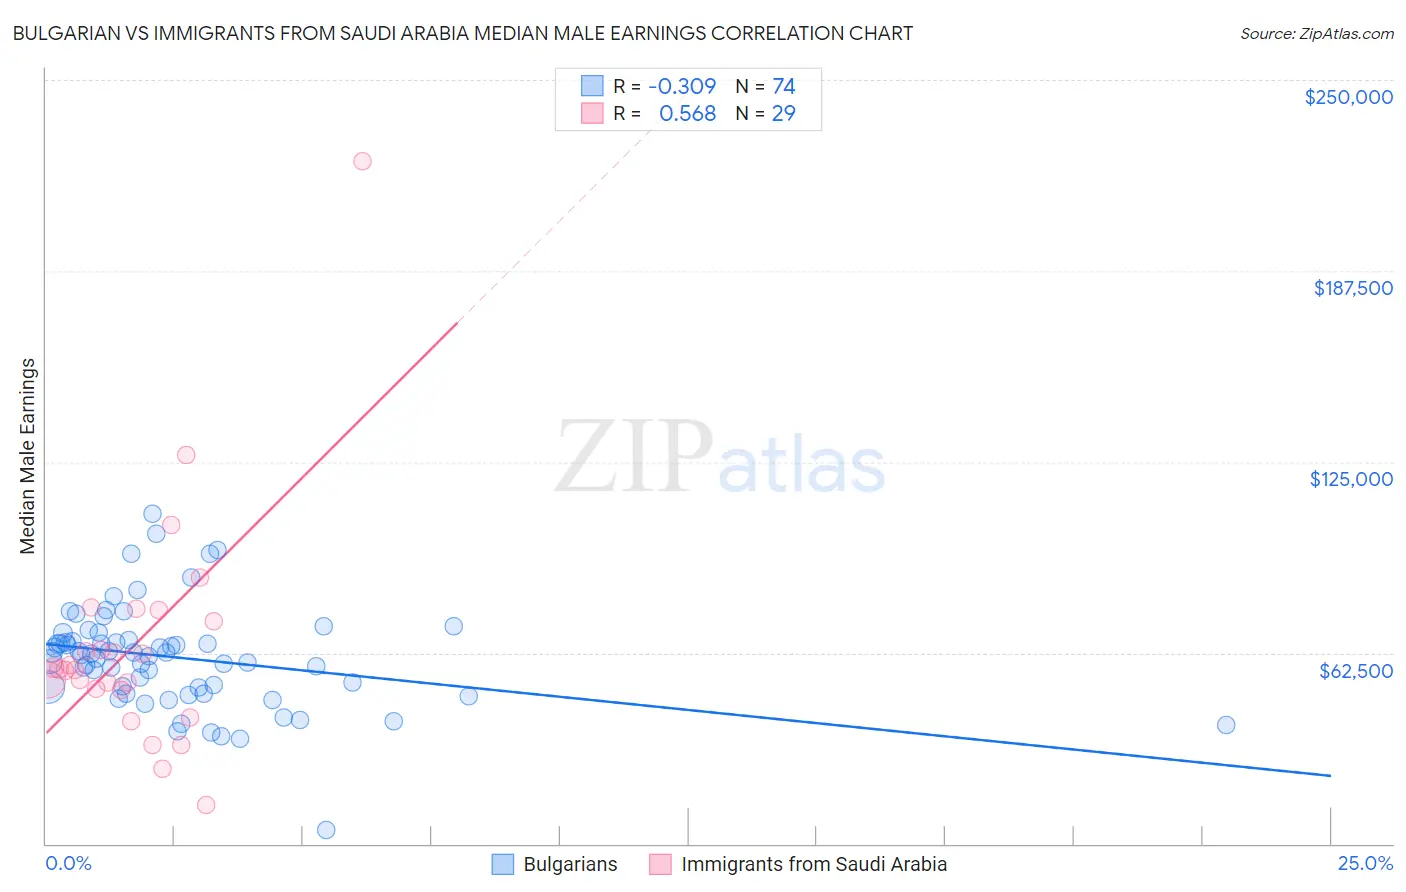
Bulgarian vs Immigrants from Saudi Arabia Median Male Earnings Correlation Chart
The statistical analysis conducted on geographies consisting of 205,598,511 people shows a mild negative correlation between the proportion of Bulgarians and median male earnings in the United States with a correlation coefficient (R) of -0.309 and weighted average of $62,378. Similarly, the statistical analysis conducted on geographies consisting of 164,293,936 people shows a substantial positive correlation between the proportion of Immigrants from Saudi Arabia and median male earnings in the United States with a correlation coefficient (R) of 0.568 and weighted average of $56,452, a difference of 10.5%.
Median Male Earnings Correlation Summary
| Measurement | Bulgarian | Immigrants from Saudi Arabia |
| Minimum | $4,447 | $12,696 |
| Maximum | $108,199 | $223,261 |
| Range | $103,752 | $210,565 |
| Mean | $60,992 | $64,851 |
| Median | $62,011 | $57,085 |
| Interquartile 25% (IQ1) | $51,254 | $50,362 |
| Interquartile 75% (IQ3) | $66,727 | $74,807 |
| Interquartile Range (IQR) | $15,473 | $24,445 |
| Standard Deviation (Sample) | $16,836 | $38,008 |
| Standard Deviation (Population) | $16,722 | $37,347 |
Similar Demographics by Median Male Earnings
Demographics Similar to Bulgarians by Median Male Earnings
In terms of median male earnings, the demographic groups most similar to Bulgarians are Cambodian ($62,516, a difference of 0.22%), Immigrants from Czechoslovakia ($62,217, a difference of 0.26%), Immigrants from Austria ($62,164, a difference of 0.35%), Immigrants from Malaysia ($62,121, a difference of 0.41%), and Immigrants from Belarus ($62,658, a difference of 0.45%).
| Demographics | Rating | Rank | Median Male Earnings |
| Maltese | 100.0 /100 | #38 | Exceptional $62,953 |
| Immigrants | South Africa | 100.0 /100 | #39 | Exceptional $62,899 |
| Australians | 100.0 /100 | #40 | Exceptional $62,857 |
| Immigrants | Turkey | 100.0 /100 | #41 | Exceptional $62,728 |
| Immigrants | Greece | 100.0 /100 | #42 | Exceptional $62,689 |
| Immigrants | Belarus | 100.0 /100 | #43 | Exceptional $62,658 |
| Cambodians | 100.0 /100 | #44 | Exceptional $62,516 |
| Bulgarians | 100.0 /100 | #45 | Exceptional $62,378 |
| Immigrants | Czechoslovakia | 99.9 /100 | #46 | Exceptional $62,217 |
| Immigrants | Austria | 99.9 /100 | #47 | Exceptional $62,164 |
| Immigrants | Malaysia | 99.9 /100 | #48 | Exceptional $62,121 |
| Immigrants | Europe | 99.9 /100 | #49 | Exceptional $62,057 |
| Bhutanese | 99.9 /100 | #50 | Exceptional $61,759 |
| Estonians | 99.9 /100 | #51 | Exceptional $61,710 |
| Immigrants | Norway | 99.9 /100 | #52 | Exceptional $61,628 |
Demographics Similar to Immigrants from Saudi Arabia by Median Male Earnings
In terms of median male earnings, the demographic groups most similar to Immigrants from Saudi Arabia are Irish ($56,464, a difference of 0.020%), Moroccan ($56,499, a difference of 0.080%), Slavic ($56,390, a difference of 0.11%), Immigrants from Germany ($56,542, a difference of 0.16%), and Czech ($56,546, a difference of 0.17%).
| Demographics | Rating | Rank | Median Male Earnings |
| Pakistanis | 89.9 /100 | #129 | Excellent $56,719 |
| Koreans | 89.4 /100 | #130 | Excellent $56,672 |
| Portuguese | 89.4 /100 | #131 | Excellent $56,663 |
| Czechs | 88.2 /100 | #132 | Excellent $56,546 |
| Immigrants | Germany | 88.2 /100 | #133 | Excellent $56,542 |
| Moroccans | 87.7 /100 | #134 | Excellent $56,499 |
| Irish | 87.4 /100 | #135 | Excellent $56,464 |
| Immigrants | Saudi Arabia | 87.2 /100 | #136 | Excellent $56,452 |
| Slavs | 86.5 /100 | #137 | Excellent $56,390 |
| Slovaks | 85.5 /100 | #138 | Excellent $56,306 |
| Zimbabweans | 85.5 /100 | #139 | Excellent $56,302 |
| Luxembourgers | 85.5 /100 | #140 | Excellent $56,300 |
| Danes | 84.8 /100 | #141 | Excellent $56,246 |
| Ethiopians | 84.8 /100 | #142 | Excellent $56,243 |
| Sri Lankans | 83.4 /100 | #143 | Excellent $56,136 |