Assyrian/Chaldean/Syriac vs Immigrants from Saudi Arabia Householder Income Under 25 years
COMPARE
Assyrian/Chaldean/Syriac
Immigrants from Saudi Arabia
Householder Income Under 25 years
Householder Income Under 25 years Comparison
Assyrians/Chaldeans/Syriacs
Immigrants from Saudi Arabia
$65,329
HOUSEHOLDER INCOME UNDER 25 YEARS
100.0/ 100
METRIC RATING
1st/ 347
METRIC RANK
$46,187
HOUSEHOLDER INCOME UNDER 25 YEARS
0.0/ 100
METRIC RATING
323rd/ 347
METRIC RANK
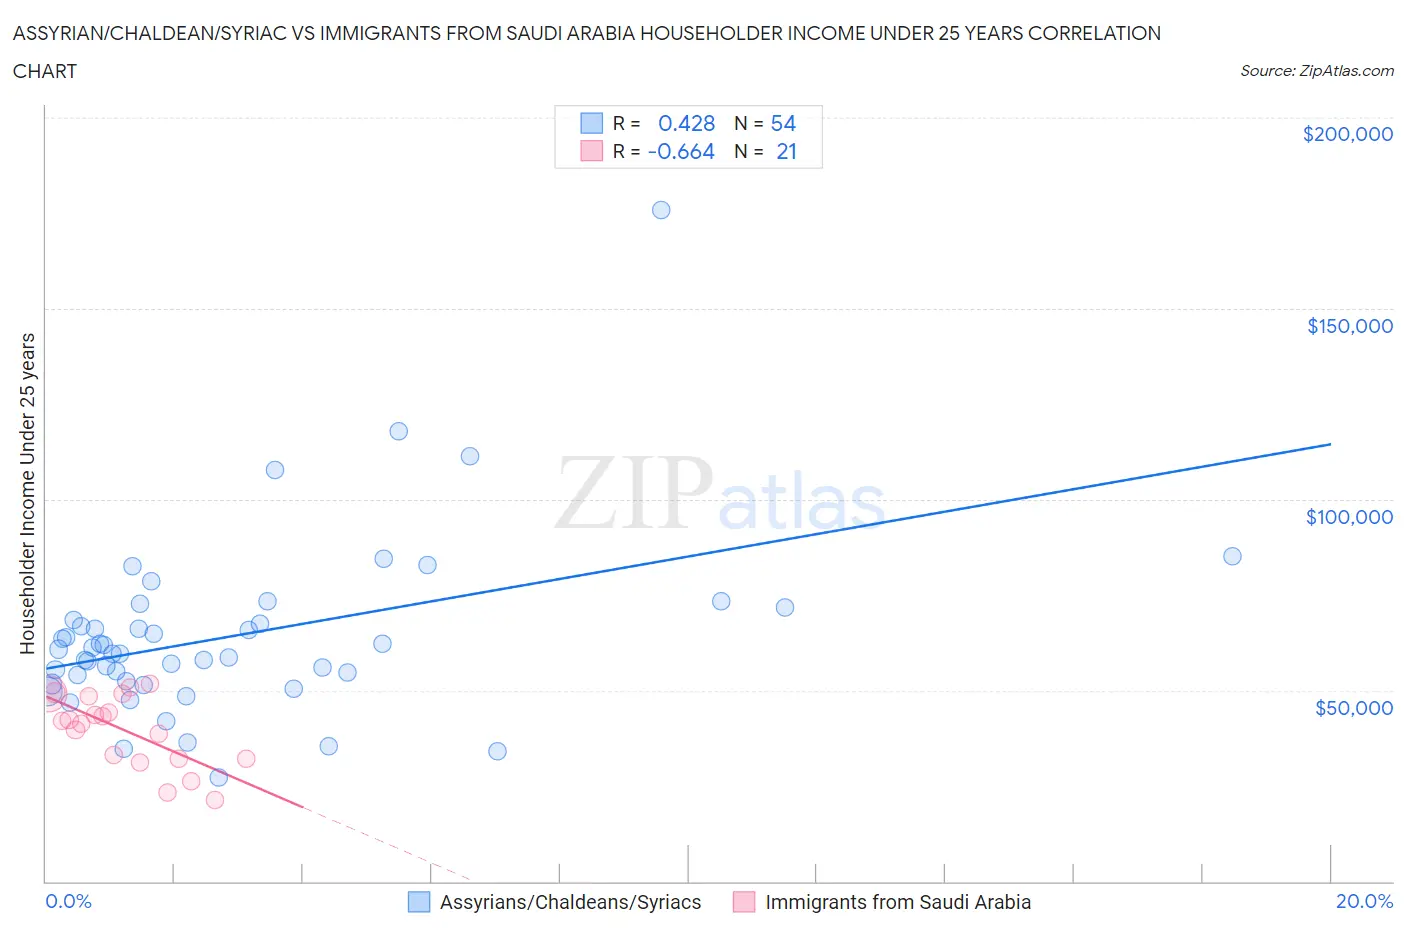
Assyrian/Chaldean/Syriac vs Immigrants from Saudi Arabia Householder Income Under 25 years Correlation Chart
The statistical analysis conducted on geographies consisting of 100,770,753 people shows a moderate positive correlation between the proportion of Assyrians/Chaldeans/Syriacs and household income with householder under the age of 25 in the United States with a correlation coefficient (R) of 0.428 and weighted average of $65,329. Similarly, the statistical analysis conducted on geographies consisting of 152,509,981 people shows a significant negative correlation between the proportion of Immigrants from Saudi Arabia and household income with householder under the age of 25 in the United States with a correlation coefficient (R) of -0.664 and weighted average of $46,187, a difference of 41.4%.
Householder Income Under 25 years Correlation Summary
| Measurement | Assyrian/Chaldean/Syriac | Immigrants from Saudi Arabia |
| Minimum | $27,045 | $21,200 |
| Maximum | $175,865 | $51,786 |
| Range | $148,820 | $30,586 |
| Mean | $64,201 | $39,611 |
| Median | $60,126 | $42,009 |
| Interquartile 25% (IQ1) | $52,453 | $32,174 |
| Interquartile 75% (IQ3) | $68,319 | $48,671 |
| Interquartile Range (IQR) | $15,866 | $16,497 |
| Standard Deviation (Sample) | $23,487 | $9,248 |
| Standard Deviation (Population) | $23,269 | $9,026 |
Similar Demographics by Householder Income Under 25 years
Demographics Similar to Assyrians/Chaldeans/Syriacs by Householder Income Under 25 years
In terms of householder income under 25 years, the demographic groups most similar to Assyrians/Chaldeans/Syriacs are Immigrants from Hong Kong ($62,083, a difference of 5.2%), Immigrants from India ($59,914, a difference of 9.0%), Immigrants from Taiwan ($59,424, a difference of 9.9%), Immigrants from Bolivia ($59,389, a difference of 10.0%), and Thai ($59,187, a difference of 10.4%).
| Demographics | Rating | Rank | Householder Income Under 25 years |
| Assyrians/Chaldeans/Syriacs | 100.0 /100 | #1 | Exceptional $65,329 |
| Immigrants | Hong Kong | 100.0 /100 | #2 | Exceptional $62,083 |
| Immigrants | India | 100.0 /100 | #3 | Exceptional $59,914 |
| Immigrants | Taiwan | 100.0 /100 | #4 | Exceptional $59,424 |
| Immigrants | Bolivia | 100.0 /100 | #5 | Exceptional $59,389 |
| Thais | 100.0 /100 | #6 | Exceptional $59,187 |
| Bolivians | 100.0 /100 | #7 | Exceptional $58,506 |
| Indians (Asian) | 100.0 /100 | #8 | Exceptional $58,239 |
| Chinese | 100.0 /100 | #9 | Exceptional $58,162 |
| Afghans | 100.0 /100 | #10 | Exceptional $58,019 |
| Immigrants | China | 100.0 /100 | #11 | Exceptional $57,931 |
| Immigrants | Philippines | 100.0 /100 | #12 | Exceptional $57,930 |
| Immigrants | South Central Asia | 100.0 /100 | #13 | Exceptional $57,818 |
| Filipinos | 100.0 /100 | #14 | Exceptional $57,740 |
| Koreans | 100.0 /100 | #15 | Exceptional $57,730 |
Demographics Similar to Immigrants from Saudi Arabia by Householder Income Under 25 years
In terms of householder income under 25 years, the demographic groups most similar to Immigrants from Saudi Arabia are Sioux ($46,417, a difference of 0.50%), Potawatomi ($46,462, a difference of 0.60%), Dutch West Indian ($45,816, a difference of 0.81%), Immigrants from Bahamas ($45,793, a difference of 0.86%), and Osage ($45,764, a difference of 0.92%).
| Demographics | Rating | Rank | Householder Income Under 25 years |
| Sudanese | 0.0 /100 | #316 | Tragic $46,982 |
| Hopi | 0.0 /100 | #317 | Tragic $46,978 |
| Spanish Americans | 0.0 /100 | #318 | Tragic $46,913 |
| Africans | 0.0 /100 | #319 | Tragic $46,838 |
| Immigrants | Sudan | 0.0 /100 | #320 | Tragic $46,791 |
| Potawatomi | 0.0 /100 | #321 | Tragic $46,462 |
| Sioux | 0.0 /100 | #322 | Tragic $46,417 |
| Immigrants | Saudi Arabia | 0.0 /100 | #323 | Tragic $46,187 |
| Dutch West Indians | 0.0 /100 | #324 | Tragic $45,816 |
| Immigrants | Bahamas | 0.0 /100 | #325 | Tragic $45,793 |
| Osage | 0.0 /100 | #326 | Tragic $45,764 |
| Bahamians | 0.0 /100 | #327 | Tragic $45,743 |
| German Russians | 0.0 /100 | #328 | Tragic $45,673 |
| Seminole | 0.0 /100 | #329 | Tragic $45,649 |
| Indonesians | 0.0 /100 | #330 | Tragic $45,566 |