Czech vs Immigrants from Saudi Arabia Median Male Earnings
COMPARE
Czech
Immigrants from Saudi Arabia
Median Male Earnings
Median Male Earnings Comparison
Czechs
Immigrants from Saudi Arabia
$56,546
MEDIAN MALE EARNINGS
88.2/ 100
METRIC RATING
132nd/ 347
METRIC RANK
$56,452
MEDIAN MALE EARNINGS
87.2/ 100
METRIC RATING
136th/ 347
METRIC RANK
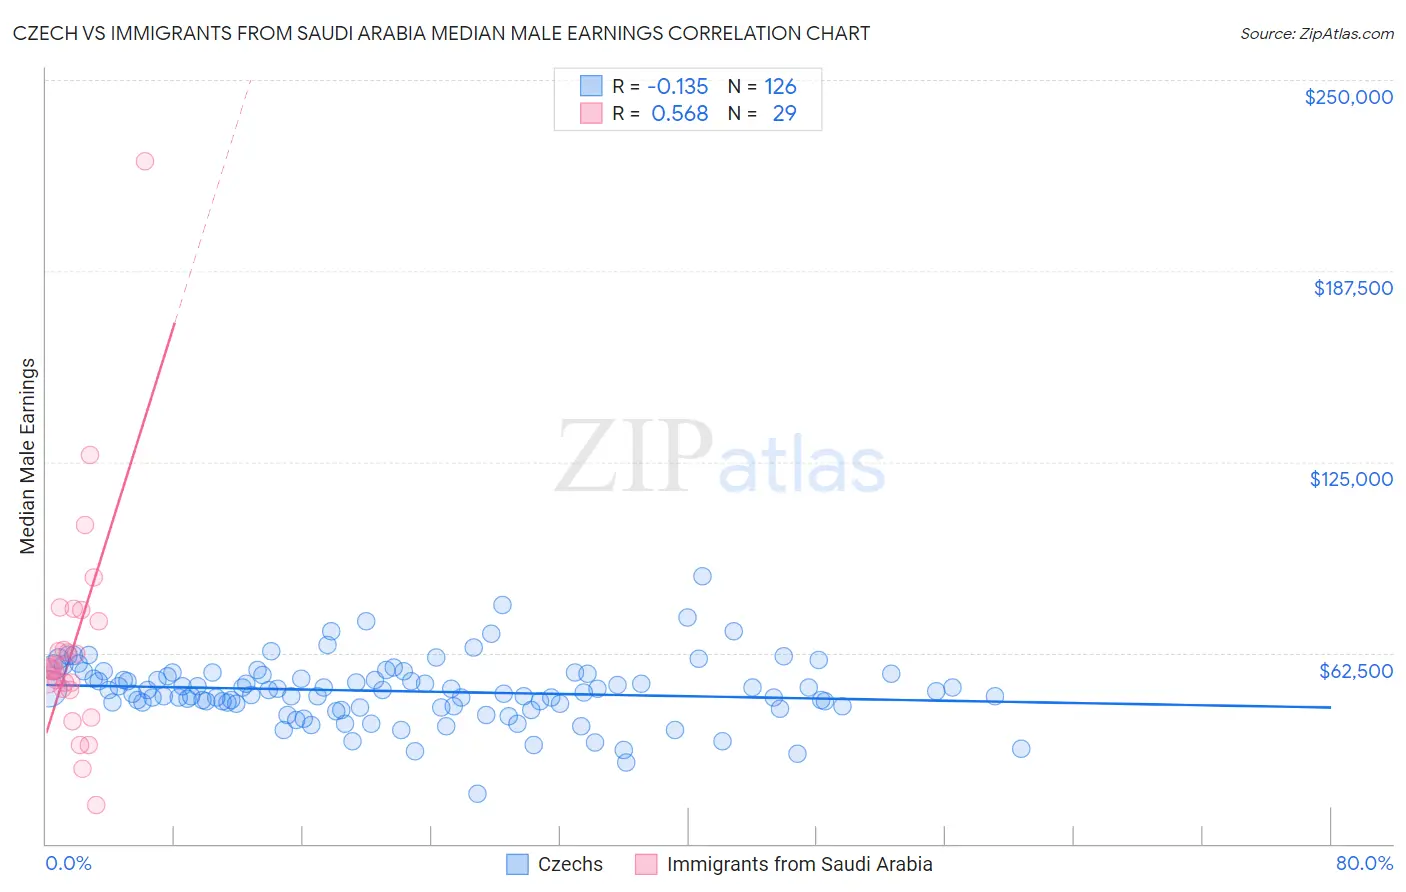
Czech vs Immigrants from Saudi Arabia Median Male Earnings Correlation Chart
The statistical analysis conducted on geographies consisting of 484,464,661 people shows a poor negative correlation between the proportion of Czechs and median male earnings in the United States with a correlation coefficient (R) of -0.135 and weighted average of $56,546. Similarly, the statistical analysis conducted on geographies consisting of 164,293,936 people shows a substantial positive correlation between the proportion of Immigrants from Saudi Arabia and median male earnings in the United States with a correlation coefficient (R) of 0.568 and weighted average of $56,452, a difference of 0.17%.
Median Male Earnings Correlation Summary
| Measurement | Czech | Immigrants from Saudi Arabia |
| Minimum | $16,298 | $12,696 |
| Maximum | $87,500 | $223,261 |
| Range | $71,202 | $210,565 |
| Mean | $49,947 | $64,851 |
| Median | $50,154 | $57,085 |
| Interquartile 25% (IQ1) | $45,179 | $50,362 |
| Interquartile 75% (IQ3) | $55,641 | $74,807 |
| Interquartile Range (IQR) | $10,462 | $24,445 |
| Standard Deviation (Sample) | $10,298 | $38,008 |
| Standard Deviation (Population) | $10,257 | $37,347 |
Demographics Similar to Czechs and Immigrants from Saudi Arabia by Median Male Earnings
In terms of median male earnings, the demographic groups most similar to Czechs are Immigrants from Germany ($56,542, a difference of 0.010%), Moroccan ($56,499, a difference of 0.080%), Irish ($56,464, a difference of 0.14%), Portuguese ($56,663, a difference of 0.21%), and Korean ($56,672, a difference of 0.22%). Similarly, the demographic groups most similar to Immigrants from Saudi Arabia are Irish ($56,464, a difference of 0.020%), Moroccan ($56,499, a difference of 0.080%), Slavic ($56,390, a difference of 0.11%), Immigrants from Germany ($56,542, a difference of 0.16%), and Slovak ($56,306, a difference of 0.26%).
| Demographics | Rating | Rank | Median Male Earnings |
| Chileans | 91.9 /100 | #124 | Exceptional $56,973 |
| Immigrants | Morocco | 91.8 /100 | #125 | Exceptional $56,958 |
| Chinese | 91.1 /100 | #126 | Exceptional $56,872 |
| Brazilians | 90.9 /100 | #127 | Exceptional $56,837 |
| Immigrants | Syria | 90.8 /100 | #128 | Exceptional $56,830 |
| Pakistanis | 89.9 /100 | #129 | Excellent $56,719 |
| Koreans | 89.4 /100 | #130 | Excellent $56,672 |
| Portuguese | 89.4 /100 | #131 | Excellent $56,663 |
| Czechs | 88.2 /100 | #132 | Excellent $56,546 |
| Immigrants | Germany | 88.2 /100 | #133 | Excellent $56,542 |
| Moroccans | 87.7 /100 | #134 | Excellent $56,499 |
| Irish | 87.4 /100 | #135 | Excellent $56,464 |
| Immigrants | Saudi Arabia | 87.2 /100 | #136 | Excellent $56,452 |
| Slavs | 86.5 /100 | #137 | Excellent $56,390 |
| Slovaks | 85.5 /100 | #138 | Excellent $56,306 |
| Zimbabweans | 85.5 /100 | #139 | Excellent $56,302 |
| Luxembourgers | 85.5 /100 | #140 | Excellent $56,300 |
| Danes | 84.8 /100 | #141 | Excellent $56,246 |
| Ethiopians | 84.8 /100 | #142 | Excellent $56,243 |
| Sri Lankans | 83.4 /100 | #143 | Excellent $56,136 |
| Immigrants | Uganda | 82.4 /100 | #144 | Excellent $56,064 |