Assyrian/Chaldean/Syriac vs Immigrants from Saudi Arabia Seniors Poverty Over the Age of 75
COMPARE
Assyrian/Chaldean/Syriac
Immigrants from Saudi Arabia
Seniors Poverty Over the Age of 75
Seniors Poverty Over the Age of 75 Comparison
Assyrians/Chaldeans/Syriacs
Immigrants from Saudi Arabia
10.7%
SENIORS POVERTY OVER THE AGE OF 75
99.8/ 100
METRIC RATING
29th/ 347
METRIC RANK
12.2%
SENIORS POVERTY OVER THE AGE OF 75
49.5/ 100
METRIC RATING
175th/ 347
METRIC RANK
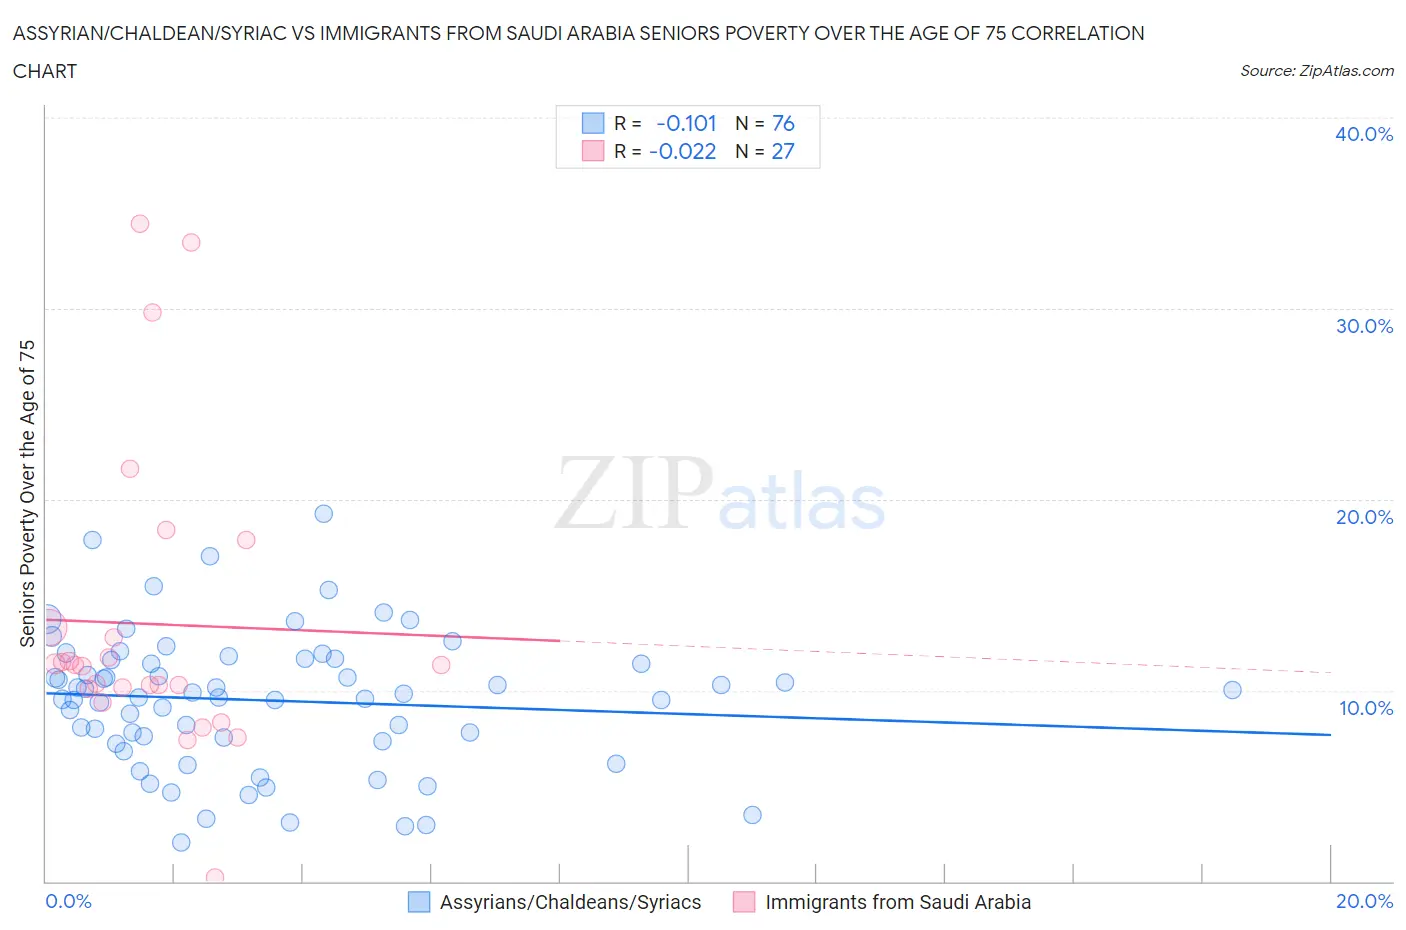
Assyrian/Chaldean/Syriac vs Immigrants from Saudi Arabia Seniors Poverty Over the Age of 75 Correlation Chart
The statistical analysis conducted on geographies consisting of 109,878,475 people shows a poor negative correlation between the proportion of Assyrians/Chaldeans/Syriacs and poverty level among seniors over the age of 75 in the United States with a correlation coefficient (R) of -0.101 and weighted average of 10.7%. Similarly, the statistical analysis conducted on geographies consisting of 163,448,927 people shows no correlation between the proportion of Immigrants from Saudi Arabia and poverty level among seniors over the age of 75 in the United States with a correlation coefficient (R) of -0.022 and weighted average of 12.2%, a difference of 13.9%.
Seniors Poverty Over the Age of 75 Correlation Summary
| Measurement | Assyrian/Chaldean/Syriac | Immigrants from Saudi Arabia |
| Minimum | 2.1% | 0.23% |
| Maximum | 19.3% | 34.4% |
| Range | 17.2% | 34.2% |
| Mean | 9.5% | 13.5% |
| Median | 9.7% | 11.3% |
| Interquartile 25% (IQ1) | 7.4% | 10.1% |
| Interquartile 75% (IQ3) | 11.6% | 13.3% |
| Interquartile Range (IQR) | 4.2% | 3.2% |
| Standard Deviation (Sample) | 3.5% | 7.9% |
| Standard Deviation (Population) | 3.5% | 7.8% |
Similar Demographics by Seniors Poverty Over the Age of 75
Demographics Similar to Assyrians/Chaldeans/Syriacs by Seniors Poverty Over the Age of 75
In terms of seniors poverty over the age of 75, the demographic groups most similar to Assyrians/Chaldeans/Syriacs are Swiss (10.7%, a difference of 0.080%), Irish (10.7%, a difference of 0.15%), Northern European (10.7%, a difference of 0.21%), Marshallese (10.7%, a difference of 0.26%), and British (10.7%, a difference of 0.40%).
| Demographics | Rating | Rank | Seniors Poverty Over the Age of 75 |
| Bhutanese | 99.8 /100 | #22 | Exceptional 10.6% |
| Lithuanians | 99.8 /100 | #23 | Exceptional 10.6% |
| Poles | 99.8 /100 | #24 | Exceptional 10.6% |
| Menominee | 99.8 /100 | #25 | Exceptional 10.6% |
| Bulgarians | 99.8 /100 | #26 | Exceptional 10.7% |
| Northern Europeans | 99.8 /100 | #27 | Exceptional 10.7% |
| Irish | 99.8 /100 | #28 | Exceptional 10.7% |
| Assyrians/Chaldeans/Syriacs | 99.8 /100 | #29 | Exceptional 10.7% |
| Swiss | 99.7 /100 | #30 | Exceptional 10.7% |
| Marshallese | 99.7 /100 | #31 | Exceptional 10.7% |
| British | 99.7 /100 | #32 | Exceptional 10.7% |
| Puget Sound Salish | 99.7 /100 | #33 | Exceptional 10.8% |
| Italians | 99.7 /100 | #34 | Exceptional 10.8% |
| Luxembourgers | 99.6 /100 | #35 | Exceptional 10.8% |
| Scotch-Irish | 99.6 /100 | #36 | Exceptional 10.8% |
Demographics Similar to Immigrants from Saudi Arabia by Seniors Poverty Over the Age of 75
In terms of seniors poverty over the age of 75, the demographic groups most similar to Immigrants from Saudi Arabia are Immigrants from Europe (12.2%, a difference of 0.040%), Arab (12.2%, a difference of 0.080%), Immigrants from Iran (12.2%, a difference of 0.11%), Immigrants from Asia (12.2%, a difference of 0.13%), and Spaniard (12.2%, a difference of 0.17%).
| Demographics | Rating | Rank | Seniors Poverty Over the Age of 75 |
| Immigrants | Syria | 53.9 /100 | #168 | Average 12.2% |
| Immigrants | Egypt | 53.7 /100 | #169 | Average 12.2% |
| Immigrants | Thailand | 52.0 /100 | #170 | Average 12.2% |
| Spaniards | 51.6 /100 | #171 | Average 12.2% |
| Immigrants | Fiji | 51.5 /100 | #172 | Average 12.2% |
| Arabs | 50.5 /100 | #173 | Average 12.2% |
| Immigrants | Europe | 50.0 /100 | #174 | Average 12.2% |
| Immigrants | Saudi Arabia | 49.5 /100 | #175 | Average 12.2% |
| Immigrants | Iran | 48.1 /100 | #176 | Average 12.2% |
| Immigrants | Asia | 47.8 /100 | #177 | Average 12.2% |
| Immigrants | Nonimmigrants | 46.8 /100 | #178 | Average 12.2% |
| Mongolians | 45.5 /100 | #179 | Average 12.2% |
| Immigrants | South Eastern Asia | 44.3 /100 | #180 | Average 12.2% |
| Immigrants | Australia | 44.2 /100 | #181 | Average 12.2% |
| German Russians | 41.4 /100 | #182 | Average 12.3% |