Uruguayan vs Mexican American Indian Median Household Income
COMPARE
Uruguayan
Mexican American Indian
Median Household Income
Median Household Income Comparison
Uruguayans
Mexican American Indians
$84,691
MEDIAN HOUSEHOLD INCOME
43.5/ 100
METRIC RATING
182nd/ 347
METRIC RANK
$78,166
MEDIAN HOUSEHOLD INCOME
1.2/ 100
METRIC RATING
251st/ 347
METRIC RANK
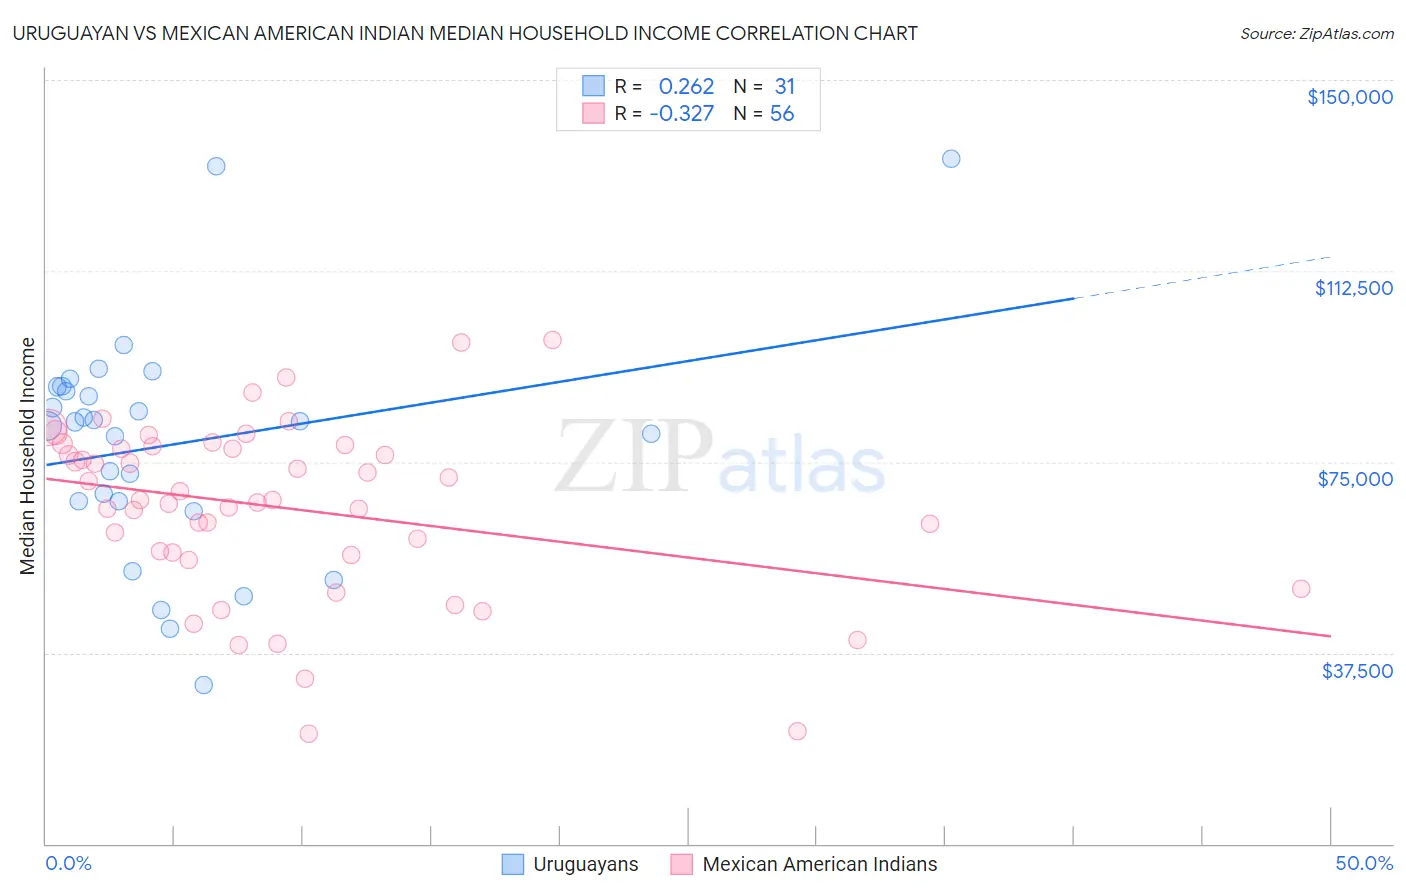
Uruguayan vs Mexican American Indian Median Household Income Correlation Chart
The statistical analysis conducted on geographies consisting of 144,748,959 people shows a weak positive correlation between the proportion of Uruguayans and median household income in the United States with a correlation coefficient (R) of 0.262 and weighted average of $84,691. Similarly, the statistical analysis conducted on geographies consisting of 317,474,541 people shows a mild negative correlation between the proportion of Mexican American Indians and median household income in the United States with a correlation coefficient (R) of -0.327 and weighted average of $78,166, a difference of 8.4%.
Median Household Income Correlation Summary
| Measurement | Uruguayan | Mexican American Indian |
| Minimum | $31,250 | $21,567 |
| Maximum | $134,635 | $98,902 |
| Range | $103,385 | $77,335 |
| Mean | $78,489 | $65,927 |
| Median | $82,857 | $67,552 |
| Interquartile 25% (IQ1) | $67,190 | $56,868 |
| Interquartile 75% (IQ3) | $89,740 | $77,810 |
| Interquartile Range (IQR) | $22,550 | $20,942 |
| Standard Deviation (Sample) | $22,490 | $17,155 |
| Standard Deviation (Population) | $22,125 | $17,001 |
Similar Demographics by Median Household Income
Demographics Similar to Uruguayans by Median Household Income
In terms of median household income, the demographic groups most similar to Uruguayans are Hawaiian ($84,729, a difference of 0.040%), Immigrants from Portugal ($84,740, a difference of 0.060%), Spaniard ($84,644, a difference of 0.060%), English ($84,915, a difference of 0.26%), and Czechoslovakian ($84,965, a difference of 0.32%).
| Demographics | Rating | Rank | Median Household Income |
| Immigrants | Costa Rica | 49.2 /100 | #175 | Average $85,054 |
| Alsatians | 49.2 /100 | #176 | Average $85,053 |
| Immigrants | Eritrea | 48.8 /100 | #177 | Average $85,025 |
| Czechoslovakians | 47.8 /100 | #178 | Average $84,965 |
| English | 47.0 /100 | #179 | Average $84,915 |
| Immigrants | Portugal | 44.2 /100 | #180 | Average $84,740 |
| Hawaiians | 44.1 /100 | #181 | Average $84,729 |
| Uruguayans | 43.5 /100 | #182 | Average $84,691 |
| Spaniards | 42.7 /100 | #183 | Average $84,644 |
| Immigrants | Eastern Africa | 37.4 /100 | #184 | Fair $84,299 |
| Kenyans | 34.2 /100 | #185 | Fair $84,085 |
| Puget Sound Salish | 33.2 /100 | #186 | Fair $84,011 |
| Belgians | 33.2 /100 | #187 | Fair $84,008 |
| Tlingit-Haida | 32.6 /100 | #188 | Fair $83,968 |
| Immigrants | Colombia | 31.7 /100 | #189 | Fair $83,902 |
Demographics Similar to Mexican American Indians by Median Household Income
In terms of median household income, the demographic groups most similar to Mexican American Indians are Immigrants from Laos ($78,327, a difference of 0.21%), Immigrants from West Indies ($77,956, a difference of 0.27%), West Indian ($78,455, a difference of 0.37%), Sudanese ($78,529, a difference of 0.46%), and Immigrants from St. Vincent and the Grenadines ($77,690, a difference of 0.61%).
| Demographics | Rating | Rank | Median Household Income |
| Marshallese | 1.9 /100 | #244 | Tragic $78,930 |
| Inupiat | 1.8 /100 | #245 | Tragic $78,841 |
| Central Americans | 1.7 /100 | #246 | Tragic $78,803 |
| Immigrants | Burma/Myanmar | 1.6 /100 | #247 | Tragic $78,682 |
| Sudanese | 1.5 /100 | #248 | Tragic $78,529 |
| West Indians | 1.4 /100 | #249 | Tragic $78,455 |
| Immigrants | Laos | 1.3 /100 | #250 | Tragic $78,327 |
| Mexican American Indians | 1.2 /100 | #251 | Tragic $78,166 |
| Immigrants | West Indies | 1.0 /100 | #252 | Tragic $77,956 |
| Immigrants | St. Vincent and the Grenadines | 0.9 /100 | #253 | Tragic $77,690 |
| Sub-Saharan Africans | 0.8 /100 | #254 | Tragic $77,631 |
| Immigrants | Middle Africa | 0.8 /100 | #255 | Tragic $77,559 |
| Belizeans | 0.6 /100 | #256 | Tragic $77,028 |
| Immigrants | Senegal | 0.5 /100 | #257 | Tragic $76,915 |
| Immigrants | Nicaragua | 0.5 /100 | #258 | Tragic $76,784 |