Bangladeshi vs Mexican American Indian Median Household Income
COMPARE
Bangladeshi
Mexican American Indian
Median Household Income
Median Household Income Comparison
Bangladeshis
Mexican American Indians
$74,112
MEDIAN HOUSEHOLD INCOME
0.1/ 100
METRIC RATING
290th/ 347
METRIC RANK
$78,166
MEDIAN HOUSEHOLD INCOME
1.2/ 100
METRIC RATING
251st/ 347
METRIC RANK
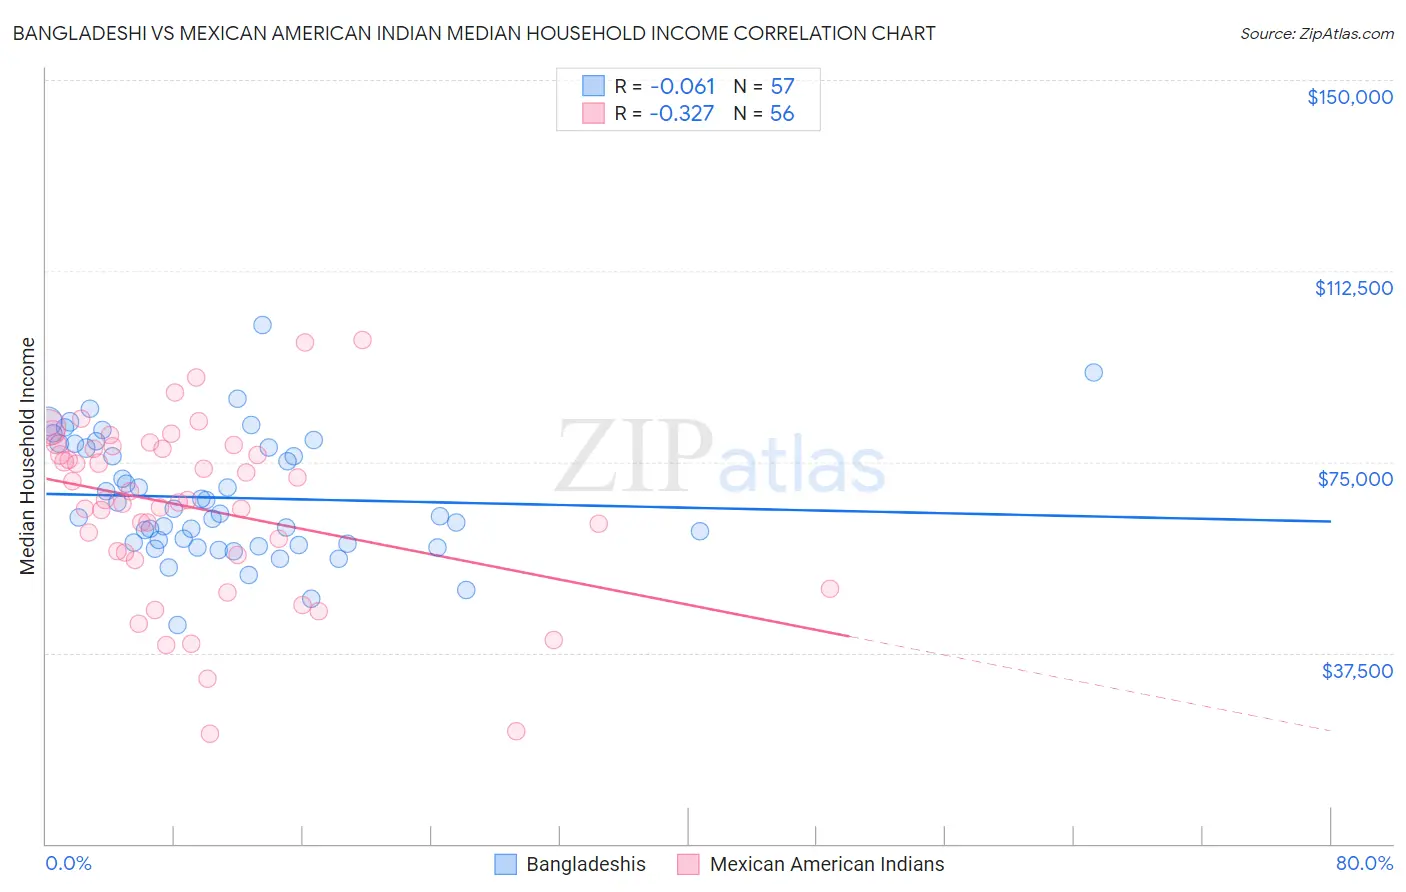
Bangladeshi vs Mexican American Indian Median Household Income Correlation Chart
The statistical analysis conducted on geographies consisting of 141,320,446 people shows a slight negative correlation between the proportion of Bangladeshis and median household income in the United States with a correlation coefficient (R) of -0.061 and weighted average of $74,112. Similarly, the statistical analysis conducted on geographies consisting of 317,474,541 people shows a mild negative correlation between the proportion of Mexican American Indians and median household income in the United States with a correlation coefficient (R) of -0.327 and weighted average of $78,166, a difference of 5.5%.
Median Household Income Correlation Summary
| Measurement | Bangladeshi | Mexican American Indian |
| Minimum | $42,858 | $21,567 |
| Maximum | $101,820 | $98,902 |
| Range | $58,962 | $77,335 |
| Mean | $67,935 | $65,927 |
| Median | $64,799 | $67,552 |
| Interquartile 25% (IQ1) | $58,792 | $56,868 |
| Interquartile 75% (IQ3) | $78,284 | $77,810 |
| Interquartile Range (IQR) | $19,492 | $20,942 |
| Standard Deviation (Sample) | $11,839 | $17,155 |
| Standard Deviation (Population) | $11,735 | $17,001 |
Similar Demographics by Median Household Income
Demographics Similar to Bangladeshis by Median Household Income
In terms of median household income, the demographic groups most similar to Bangladeshis are Fijian ($74,205, a difference of 0.13%), Immigrants from Central America ($74,217, a difference of 0.14%), Iroquois ($74,279, a difference of 0.23%), Immigrants from Somalia ($74,300, a difference of 0.25%), and Mexican ($74,399, a difference of 0.39%).
| Demographics | Rating | Rank | Median Household Income |
| Cree | 0.1 /100 | #283 | Tragic $74,685 |
| Yaqui | 0.1 /100 | #284 | Tragic $74,596 |
| Mexicans | 0.1 /100 | #285 | Tragic $74,399 |
| Immigrants | Somalia | 0.1 /100 | #286 | Tragic $74,300 |
| Iroquois | 0.1 /100 | #287 | Tragic $74,279 |
| Immigrants | Central America | 0.1 /100 | #288 | Tragic $74,217 |
| Fijians | 0.1 /100 | #289 | Tragic $74,205 |
| Bangladeshis | 0.1 /100 | #290 | Tragic $74,112 |
| Hispanics or Latinos | 0.1 /100 | #291 | Tragic $73,823 |
| Comanche | 0.1 /100 | #292 | Tragic $73,747 |
| Immigrants | Cabo Verde | 0.1 /100 | #293 | Tragic $73,515 |
| Blackfeet | 0.1 /100 | #294 | Tragic $73,509 |
| Cubans | 0.1 /100 | #295 | Tragic $73,392 |
| Haitians | 0.1 /100 | #296 | Tragic $73,306 |
| Immigrants | Mexico | 0.0 /100 | #297 | Tragic $73,160 |
Demographics Similar to Mexican American Indians by Median Household Income
In terms of median household income, the demographic groups most similar to Mexican American Indians are Immigrants from Laos ($78,327, a difference of 0.21%), Immigrants from West Indies ($77,956, a difference of 0.27%), West Indian ($78,455, a difference of 0.37%), Sudanese ($78,529, a difference of 0.46%), and Immigrants from St. Vincent and the Grenadines ($77,690, a difference of 0.61%).
| Demographics | Rating | Rank | Median Household Income |
| Marshallese | 1.9 /100 | #244 | Tragic $78,930 |
| Inupiat | 1.8 /100 | #245 | Tragic $78,841 |
| Central Americans | 1.7 /100 | #246 | Tragic $78,803 |
| Immigrants | Burma/Myanmar | 1.6 /100 | #247 | Tragic $78,682 |
| Sudanese | 1.5 /100 | #248 | Tragic $78,529 |
| West Indians | 1.4 /100 | #249 | Tragic $78,455 |
| Immigrants | Laos | 1.3 /100 | #250 | Tragic $78,327 |
| Mexican American Indians | 1.2 /100 | #251 | Tragic $78,166 |
| Immigrants | West Indies | 1.0 /100 | #252 | Tragic $77,956 |
| Immigrants | St. Vincent and the Grenadines | 0.9 /100 | #253 | Tragic $77,690 |
| Sub-Saharan Africans | 0.8 /100 | #254 | Tragic $77,631 |
| Immigrants | Middle Africa | 0.8 /100 | #255 | Tragic $77,559 |
| Belizeans | 0.6 /100 | #256 | Tragic $77,028 |
| Immigrants | Senegal | 0.5 /100 | #257 | Tragic $76,915 |
| Immigrants | Nicaragua | 0.5 /100 | #258 | Tragic $76,784 |