Immigrants from Romania vs Mexican American Indian Median Household Income
COMPARE
Immigrants from Romania
Mexican American Indian
Median Household Income
Median Household Income Comparison
Immigrants from Romania
Mexican American Indians
$94,222
MEDIAN HOUSEHOLD INCOME
99.7/ 100
METRIC RATING
66th/ 347
METRIC RANK
$78,166
MEDIAN HOUSEHOLD INCOME
1.2/ 100
METRIC RATING
251st/ 347
METRIC RANK
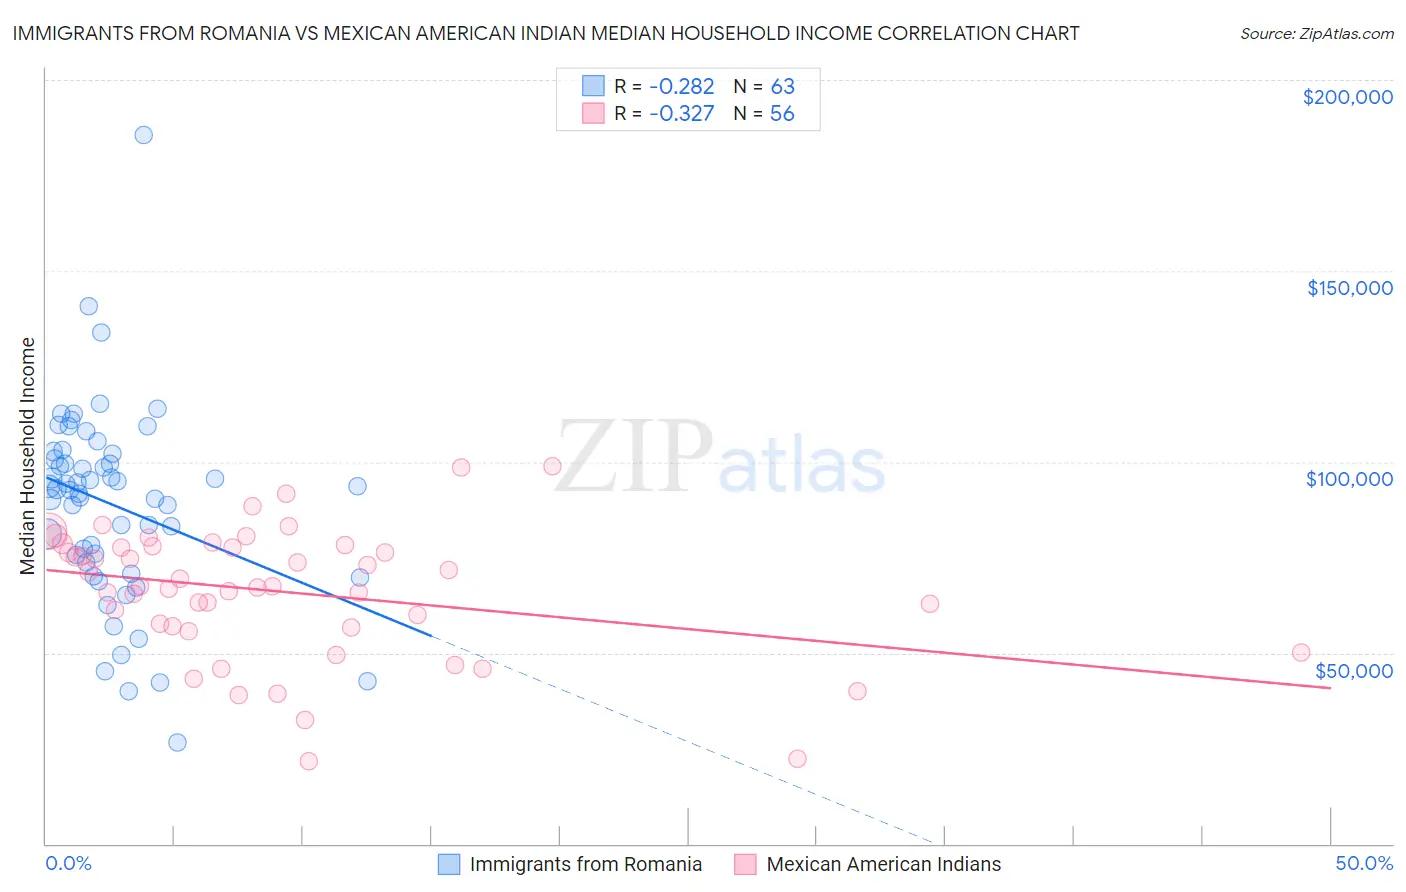
Immigrants from Romania vs Mexican American Indian Median Household Income Correlation Chart
The statistical analysis conducted on geographies consisting of 256,926,750 people shows a weak negative correlation between the proportion of Immigrants from Romania and median household income in the United States with a correlation coefficient (R) of -0.282 and weighted average of $94,222. Similarly, the statistical analysis conducted on geographies consisting of 317,474,541 people shows a mild negative correlation between the proportion of Mexican American Indians and median household income in the United States with a correlation coefficient (R) of -0.327 and weighted average of $78,166, a difference of 20.5%.
Median Household Income Correlation Summary
| Measurement | Immigrants from Romania | Mexican American Indian |
| Minimum | $26,354 | $21,567 |
| Maximum | $185,464 | $98,902 |
| Range | $159,110 | $77,335 |
| Mean | $88,756 | $65,927 |
| Median | $92,853 | $67,552 |
| Interquartile 25% (IQ1) | $73,566 | $56,868 |
| Interquartile 75% (IQ3) | $102,083 | $77,810 |
| Interquartile Range (IQR) | $28,517 | $20,942 |
| Standard Deviation (Sample) | $25,703 | $17,155 |
| Standard Deviation (Population) | $25,499 | $17,001 |
Similar Demographics by Median Household Income
Demographics Similar to Immigrants from Romania by Median Household Income
In terms of median household income, the demographic groups most similar to Immigrants from Romania are Immigrants from Scotland ($94,091, a difference of 0.14%), Immigrants from Belarus ($94,399, a difference of 0.19%), Immigrants from Netherlands ($94,411, a difference of 0.20%), Mongolian ($93,971, a difference of 0.27%), and Argentinean ($93,960, a difference of 0.28%).
| Demographics | Rating | Rank | Median Household Income |
| Immigrants | Europe | 99.8 /100 | #59 | Exceptional $95,032 |
| Koreans | 99.8 /100 | #60 | Exceptional $95,018 |
| Laotians | 99.8 /100 | #61 | Exceptional $94,990 |
| Immigrants | Norway | 99.8 /100 | #62 | Exceptional $94,846 |
| Greeks | 99.8 /100 | #63 | Exceptional $94,735 |
| Immigrants | Netherlands | 99.7 /100 | #64 | Exceptional $94,411 |
| Immigrants | Belarus | 99.7 /100 | #65 | Exceptional $94,399 |
| Immigrants | Romania | 99.7 /100 | #66 | Exceptional $94,222 |
| Immigrants | Scotland | 99.7 /100 | #67 | Exceptional $94,091 |
| Mongolians | 99.7 /100 | #68 | Exceptional $93,971 |
| Argentineans | 99.7 /100 | #69 | Exceptional $93,960 |
| Immigrants | Fiji | 99.7 /100 | #70 | Exceptional $93,933 |
| Immigrants | Philippines | 99.6 /100 | #71 | Exceptional $93,899 |
| Lithuanians | 99.6 /100 | #72 | Exceptional $93,852 |
| Immigrants | Egypt | 99.6 /100 | #73 | Exceptional $93,700 |
Demographics Similar to Mexican American Indians by Median Household Income
In terms of median household income, the demographic groups most similar to Mexican American Indians are Immigrants from Laos ($78,327, a difference of 0.21%), Immigrants from West Indies ($77,956, a difference of 0.27%), West Indian ($78,455, a difference of 0.37%), Sudanese ($78,529, a difference of 0.46%), and Immigrants from St. Vincent and the Grenadines ($77,690, a difference of 0.61%).
| Demographics | Rating | Rank | Median Household Income |
| Marshallese | 1.9 /100 | #244 | Tragic $78,930 |
| Inupiat | 1.8 /100 | #245 | Tragic $78,841 |
| Central Americans | 1.7 /100 | #246 | Tragic $78,803 |
| Immigrants | Burma/Myanmar | 1.6 /100 | #247 | Tragic $78,682 |
| Sudanese | 1.5 /100 | #248 | Tragic $78,529 |
| West Indians | 1.4 /100 | #249 | Tragic $78,455 |
| Immigrants | Laos | 1.3 /100 | #250 | Tragic $78,327 |
| Mexican American Indians | 1.2 /100 | #251 | Tragic $78,166 |
| Immigrants | West Indies | 1.0 /100 | #252 | Tragic $77,956 |
| Immigrants | St. Vincent and the Grenadines | 0.9 /100 | #253 | Tragic $77,690 |
| Sub-Saharan Africans | 0.8 /100 | #254 | Tragic $77,631 |
| Immigrants | Middle Africa | 0.8 /100 | #255 | Tragic $77,559 |
| Belizeans | 0.6 /100 | #256 | Tragic $77,028 |
| Immigrants | Senegal | 0.5 /100 | #257 | Tragic $76,915 |
| Immigrants | Nicaragua | 0.5 /100 | #258 | Tragic $76,784 |