Canadian vs Mexican American Indian Median Household Income
COMPARE
Canadian
Mexican American Indian
Median Household Income
Median Household Income Comparison
Canadians
Mexican American Indians
$87,769
MEDIAN HOUSEHOLD INCOME
84.7/ 100
METRIC RATING
142nd/ 347
METRIC RANK
$78,166
MEDIAN HOUSEHOLD INCOME
1.2/ 100
METRIC RATING
251st/ 347
METRIC RANK
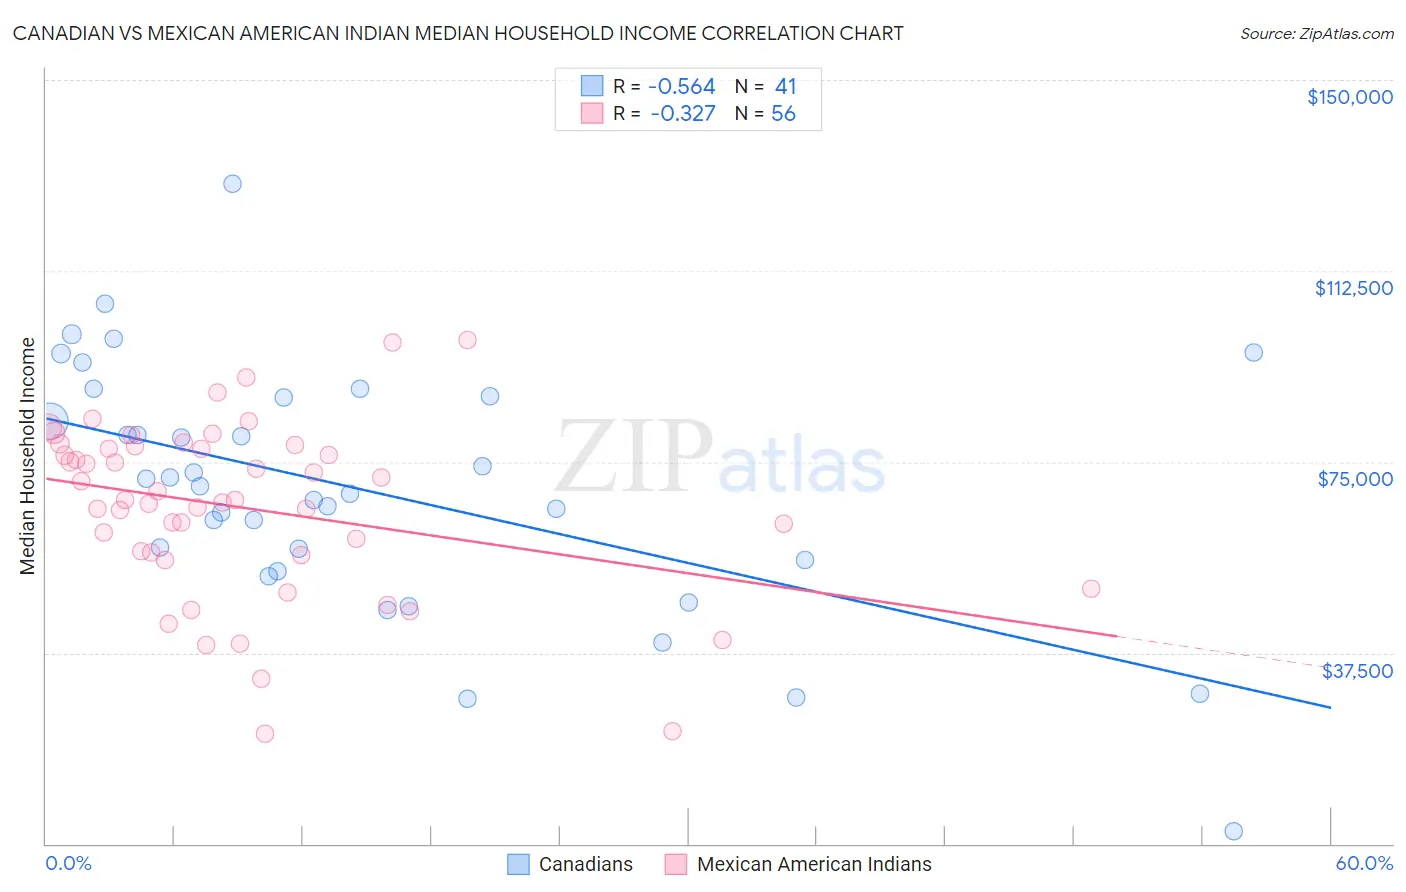
Canadian vs Mexican American Indian Median Household Income Correlation Chart
The statistical analysis conducted on geographies consisting of 437,190,973 people shows a substantial negative correlation between the proportion of Canadians and median household income in the United States with a correlation coefficient (R) of -0.564 and weighted average of $87,769. Similarly, the statistical analysis conducted on geographies consisting of 317,474,541 people shows a mild negative correlation between the proportion of Mexican American Indians and median household income in the United States with a correlation coefficient (R) of -0.327 and weighted average of $78,166, a difference of 12.3%.
Median Household Income Correlation Summary
| Measurement | Canadian | Mexican American Indian |
| Minimum | $2,499 | $21,567 |
| Maximum | $129,644 | $98,902 |
| Range | $127,145 | $77,335 |
| Mean | $69,441 | $65,927 |
| Median | $70,262 | $67,552 |
| Interquartile 25% (IQ1) | $54,608 | $56,868 |
| Interquartile 75% (IQ3) | $87,722 | $77,810 |
| Interquartile Range (IQR) | $33,114 | $20,942 |
| Standard Deviation (Sample) | $24,486 | $17,155 |
| Standard Deviation (Population) | $24,185 | $17,001 |
Similar Demographics by Median Household Income
Demographics Similar to Canadians by Median Household Income
In terms of median household income, the demographic groups most similar to Canadians are Danish ($87,676, a difference of 0.11%), Immigrants from Morocco ($87,930, a difference of 0.18%), Serbian ($87,572, a difference of 0.22%), Ugandan ($87,557, a difference of 0.24%), and Immigrants from Uganda ($87,553, a difference of 0.25%).
| Demographics | Rating | Rank | Median Household Income |
| Immigrants | Sierra Leone | 89.9 /100 | #135 | Excellent $88,498 |
| Poles | 89.7 /100 | #136 | Excellent $88,472 |
| Sierra Leoneans | 89.6 /100 | #137 | Excellent $88,463 |
| Arabs | 89.2 /100 | #138 | Excellent $88,398 |
| Immigrants | Chile | 89.2 /100 | #139 | Excellent $88,388 |
| Lebanese | 87.2 /100 | #140 | Excellent $88,091 |
| Immigrants | Morocco | 86.0 /100 | #141 | Excellent $87,930 |
| Canadians | 84.7 /100 | #142 | Excellent $87,769 |
| Danes | 83.9 /100 | #143 | Excellent $87,676 |
| Serbians | 83.0 /100 | #144 | Excellent $87,572 |
| Ugandans | 82.9 /100 | #145 | Excellent $87,557 |
| Immigrants | Uganda | 82.8 /100 | #146 | Excellent $87,553 |
| South American Indians | 81.8 /100 | #147 | Excellent $87,446 |
| Costa Ricans | 80.0 /100 | #148 | Excellent $87,262 |
| Immigrants | Nepal | 77.7 /100 | #149 | Good $87,046 |
Demographics Similar to Mexican American Indians by Median Household Income
In terms of median household income, the demographic groups most similar to Mexican American Indians are Immigrants from Laos ($78,327, a difference of 0.21%), Immigrants from West Indies ($77,956, a difference of 0.27%), West Indian ($78,455, a difference of 0.37%), Sudanese ($78,529, a difference of 0.46%), and Immigrants from St. Vincent and the Grenadines ($77,690, a difference of 0.61%).
| Demographics | Rating | Rank | Median Household Income |
| Marshallese | 1.9 /100 | #244 | Tragic $78,930 |
| Inupiat | 1.8 /100 | #245 | Tragic $78,841 |
| Central Americans | 1.7 /100 | #246 | Tragic $78,803 |
| Immigrants | Burma/Myanmar | 1.6 /100 | #247 | Tragic $78,682 |
| Sudanese | 1.5 /100 | #248 | Tragic $78,529 |
| West Indians | 1.4 /100 | #249 | Tragic $78,455 |
| Immigrants | Laos | 1.3 /100 | #250 | Tragic $78,327 |
| Mexican American Indians | 1.2 /100 | #251 | Tragic $78,166 |
| Immigrants | West Indies | 1.0 /100 | #252 | Tragic $77,956 |
| Immigrants | St. Vincent and the Grenadines | 0.9 /100 | #253 | Tragic $77,690 |
| Sub-Saharan Africans | 0.8 /100 | #254 | Tragic $77,631 |
| Immigrants | Middle Africa | 0.8 /100 | #255 | Tragic $77,559 |
| Belizeans | 0.6 /100 | #256 | Tragic $77,028 |
| Immigrants | Senegal | 0.5 /100 | #257 | Tragic $76,915 |
| Immigrants | Nicaragua | 0.5 /100 | #258 | Tragic $76,784 |