Armenian vs Immigrants from Eritrea Male Disability
COMPARE
Armenian
Immigrants from Eritrea
Male Disability
Male Disability Comparison
Armenians
Immigrants from Eritrea
10.9%
MALE DISABILITY
90.1/ 100
METRIC RATING
119th/ 347
METRIC RANK
10.4%
MALE DISABILITY
99.6/ 100
METRIC RATING
55th/ 347
METRIC RANK
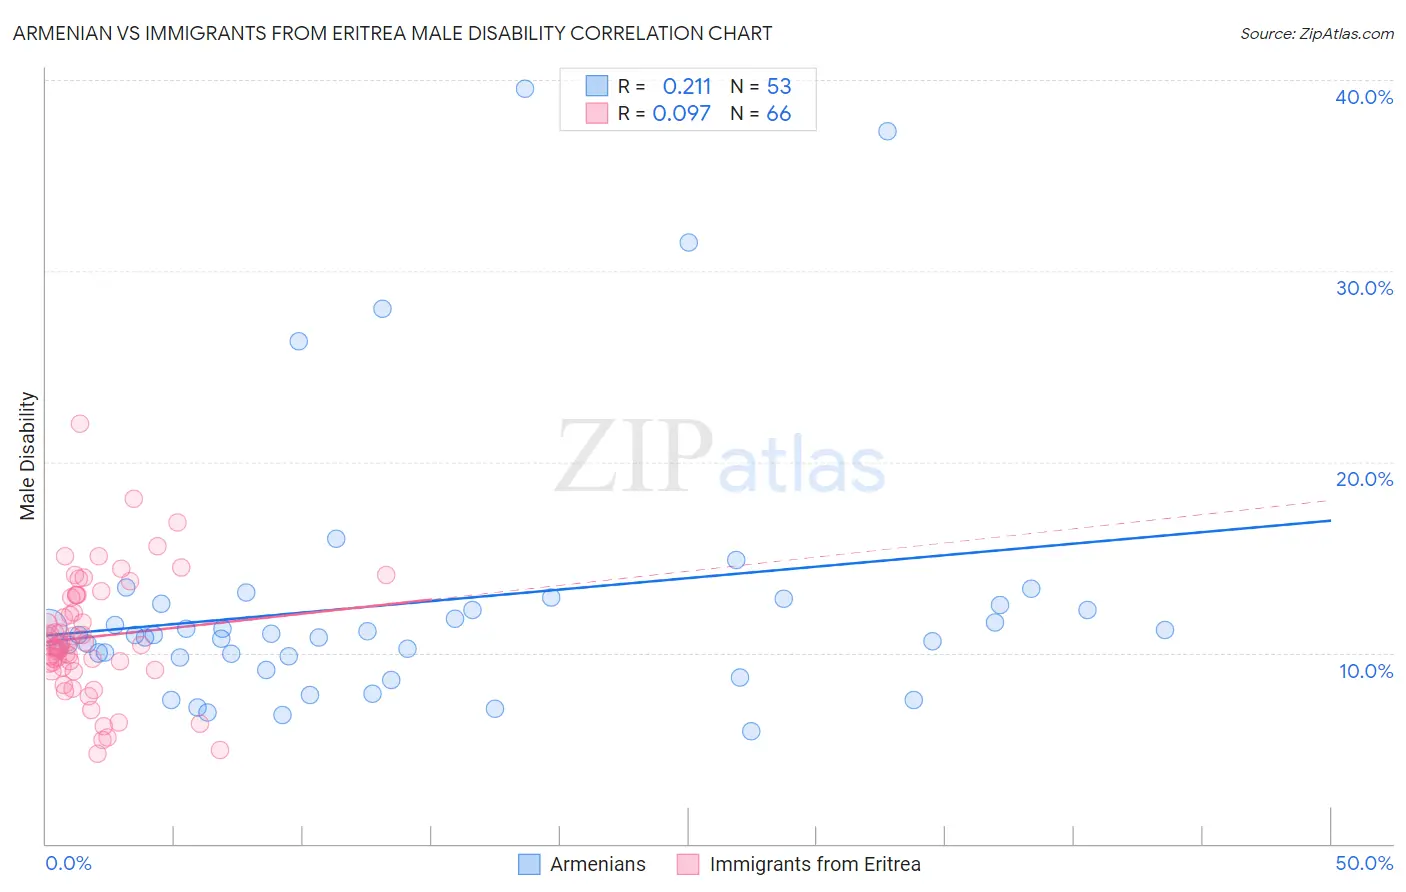
Armenian vs Immigrants from Eritrea Male Disability Correlation Chart
The statistical analysis conducted on geographies consisting of 310,935,908 people shows a weak positive correlation between the proportion of Armenians and percentage of males with a disability in the United States with a correlation coefficient (R) of 0.211 and weighted average of 10.9%. Similarly, the statistical analysis conducted on geographies consisting of 104,852,788 people shows a slight positive correlation between the proportion of Immigrants from Eritrea and percentage of males with a disability in the United States with a correlation coefficient (R) of 0.097 and weighted average of 10.4%, a difference of 4.9%.
Male Disability Correlation Summary
| Measurement | Armenian | Immigrants from Eritrea |
| Minimum | 5.9% | 4.7% |
| Maximum | 39.5% | 22.0% |
| Range | 33.7% | 17.3% |
| Mean | 12.6% | 10.8% |
| Median | 10.9% | 10.4% |
| Interquartile 25% (IQ1) | 9.8% | 9.2% |
| Interquartile 75% (IQ3) | 12.5% | 13.0% |
| Interquartile Range (IQR) | 2.8% | 3.8% |
| Standard Deviation (Sample) | 7.0% | 3.2% |
| Standard Deviation (Population) | 6.9% | 3.1% |
Similar Demographics by Male Disability
Demographics Similar to Armenians by Male Disability
In terms of male disability, the demographic groups most similar to Armenians are Immigrants from Cuba (10.9%, a difference of 0.0%), Eastern European (10.9%, a difference of 0.080%), Immigrants from Africa (10.9%, a difference of 0.11%), Immigrants from South Eastern Asia (10.9%, a difference of 0.15%), and Immigrants from Ghana (10.9%, a difference of 0.17%).
| Demographics | Rating | Rank | Male Disability |
| Ghanaians | 93.4 /100 | #112 | Exceptional 10.8% |
| Immigrants | Zimbabwe | 93.0 /100 | #113 | Exceptional 10.8% |
| Central Americans | 92.7 /100 | #114 | Exceptional 10.8% |
| Immigrants | Barbados | 92.2 /100 | #115 | Exceptional 10.8% |
| Immigrants | South Africa | 91.8 /100 | #116 | Exceptional 10.8% |
| Eastern Europeans | 90.6 /100 | #117 | Exceptional 10.9% |
| Immigrants | Cuba | 90.2 /100 | #118 | Exceptional 10.9% |
| Armenians | 90.1 /100 | #119 | Exceptional 10.9% |
| Immigrants | Africa | 89.4 /100 | #120 | Excellent 10.9% |
| Immigrants | South Eastern Asia | 89.2 /100 | #121 | Excellent 10.9% |
| Immigrants | Ghana | 89.0 /100 | #122 | Excellent 10.9% |
| Immigrants | Czechoslovakia | 88.4 /100 | #123 | Excellent 10.9% |
| South American Indians | 88.1 /100 | #124 | Excellent 10.9% |
| Immigrants | North Macedonia | 88.1 /100 | #125 | Excellent 10.9% |
| Immigrants | Trinidad and Tobago | 86.9 /100 | #126 | Excellent 10.9% |
Demographics Similar to Immigrants from Eritrea by Male Disability
In terms of male disability, the demographic groups most similar to Immigrants from Eritrea are Peruvian (10.4%, a difference of 0.020%), Tongan (10.4%, a difference of 0.040%), Immigrants from Uzbekistan (10.4%, a difference of 0.060%), Immigrants from South America (10.4%, a difference of 0.060%), and Immigrants from Saudi Arabia (10.4%, a difference of 0.080%).
| Demographics | Rating | Rank | Male Disability |
| Israelis | 99.7 /100 | #48 | Exceptional 10.3% |
| Immigrants | Spain | 99.7 /100 | #49 | Exceptional 10.3% |
| South Americans | 99.6 /100 | #50 | Exceptional 10.3% |
| Salvadorans | 99.6 /100 | #51 | Exceptional 10.4% |
| Immigrants | Saudi Arabia | 99.6 /100 | #52 | Exceptional 10.4% |
| Immigrants | Uzbekistan | 99.6 /100 | #53 | Exceptional 10.4% |
| Peruvians | 99.6 /100 | #54 | Exceptional 10.4% |
| Immigrants | Eritrea | 99.6 /100 | #55 | Exceptional 10.4% |
| Tongans | 99.6 /100 | #56 | Exceptional 10.4% |
| Immigrants | South America | 99.6 /100 | #57 | Exceptional 10.4% |
| Immigrants | Japan | 99.5 /100 | #58 | Exceptional 10.4% |
| Immigrants | Australia | 99.5 /100 | #59 | Exceptional 10.4% |
| Immigrants | Colombia | 99.5 /100 | #60 | Exceptional 10.4% |
| Immigrants | Northern Africa | 99.4 /100 | #61 | Exceptional 10.4% |
| Immigrants | Ecuador | 99.3 /100 | #62 | Exceptional 10.4% |