Armenian vs Immigrants from Albania Median Earnings
COMPARE
Armenian
Immigrants from Albania
Median Earnings
Median Earnings Comparison
Armenians
Immigrants from Albania
$49,804
MEDIAN EARNINGS
99.1/ 100
METRIC RATING
93rd/ 347
METRIC RANK
$49,377
MEDIAN EARNINGS
98.4/ 100
METRIC RATING
106th/ 347
METRIC RANK
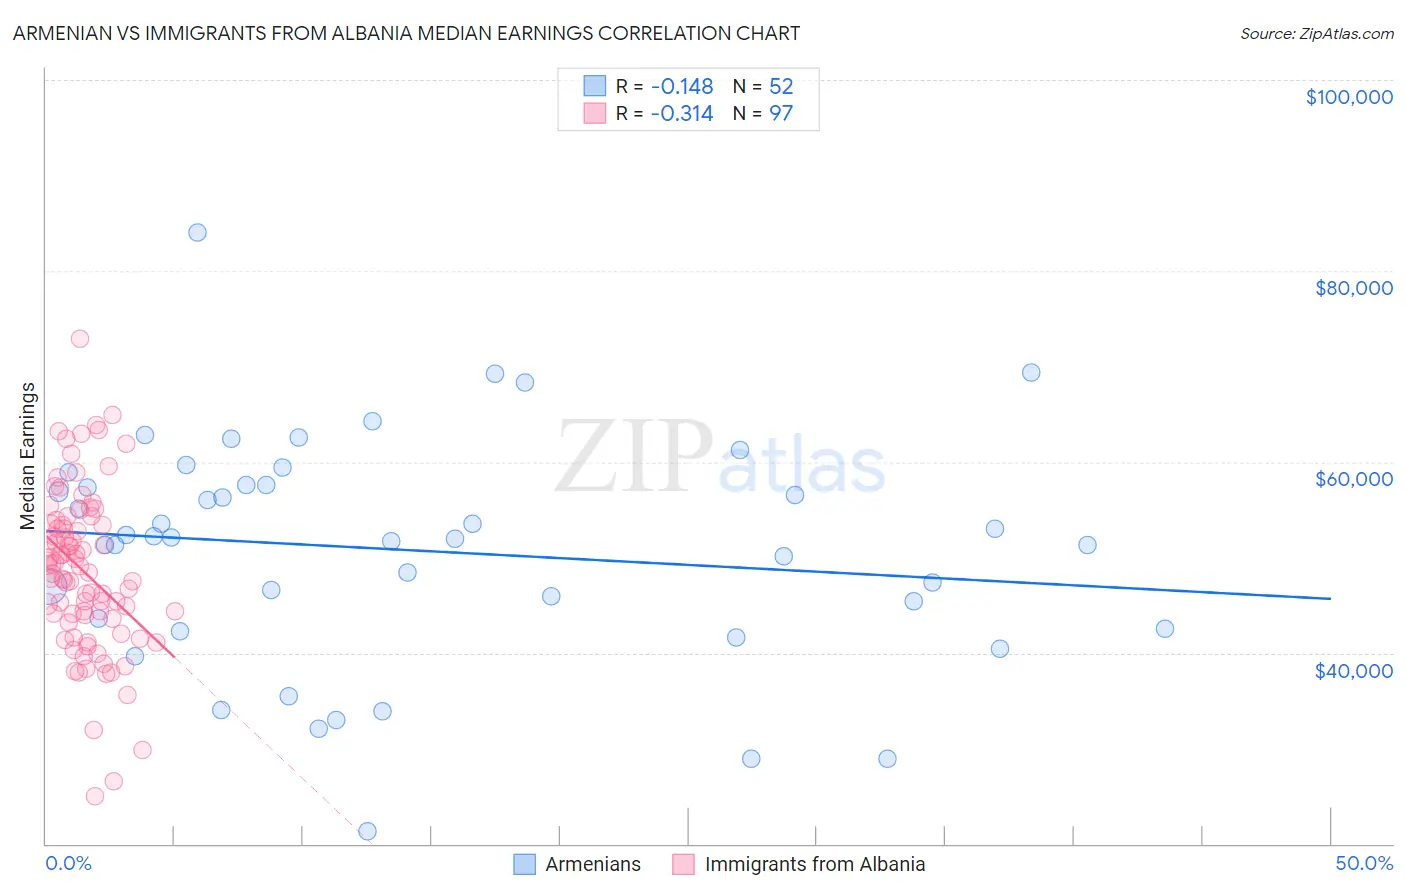
Armenian vs Immigrants from Albania Median Earnings Correlation Chart
The statistical analysis conducted on geographies consisting of 310,945,861 people shows a poor negative correlation between the proportion of Armenians and median earnings in the United States with a correlation coefficient (R) of -0.148 and weighted average of $49,804. Similarly, the statistical analysis conducted on geographies consisting of 119,374,526 people shows a mild negative correlation between the proportion of Immigrants from Albania and median earnings in the United States with a correlation coefficient (R) of -0.314 and weighted average of $49,377, a difference of 0.86%.
Median Earnings Correlation Summary
| Measurement | Armenian | Immigrants from Albania |
| Minimum | $21,250 | $24,914 |
| Maximum | $84,019 | $72,899 |
| Range | $62,769 | $47,985 |
| Mean | $50,725 | $48,556 |
| Median | $52,028 | $49,058 |
| Interquartile 25% (IQ1) | $43,022 | $43,717 |
| Interquartile 75% (IQ3) | $57,580 | $53,495 |
| Interquartile Range (IQR) | $14,558 | $9,778 |
| Standard Deviation (Sample) | $11,922 | $8,407 |
| Standard Deviation (Population) | $11,807 | $8,364 |
Demographics Similar to Armenians and Immigrants from Albania by Median Earnings
In terms of median earnings, the demographic groups most similar to Armenians are Immigrants from Argentina ($49,841, a difference of 0.070%), Croatian ($49,724, a difference of 0.16%), Immigrants from England ($49,722, a difference of 0.16%), Macedonian ($49,893, a difference of 0.18%), and Italian ($49,915, a difference of 0.22%). Similarly, the demographic groups most similar to Immigrants from Albania are Immigrants from Western Asia ($49,389, a difference of 0.020%), Immigrants from Morocco ($49,368, a difference of 0.020%), Immigrants from Brazil ($49,463, a difference of 0.17%), Austrian ($49,501, a difference of 0.25%), and Palestinian ($49,209, a difference of 0.34%).
| Demographics | Rating | Rank | Median Earnings |
| Immigrants | North America | 99.4 /100 | #89 | Exceptional $50,108 |
| Italians | 99.3 /100 | #90 | Exceptional $49,915 |
| Macedonians | 99.2 /100 | #91 | Exceptional $49,893 |
| Immigrants | Argentina | 99.2 /100 | #92 | Exceptional $49,841 |
| Armenians | 99.1 /100 | #93 | Exceptional $49,804 |
| Croatians | 99.0 /100 | #94 | Exceptional $49,724 |
| Immigrants | England | 99.0 /100 | #95 | Exceptional $49,722 |
| Immigrants | Lebanon | 99.0 /100 | #96 | Exceptional $49,682 |
| Immigrants | North Macedonia | 98.9 /100 | #97 | Exceptional $49,658 |
| Immigrants | Northern Africa | 98.9 /100 | #98 | Exceptional $49,648 |
| Immigrants | Afghanistan | 98.9 /100 | #99 | Exceptional $49,645 |
| Immigrants | Poland | 98.9 /100 | #100 | Exceptional $49,633 |
| Jordanians | 98.9 /100 | #101 | Exceptional $49,632 |
| Ethiopians | 98.8 /100 | #102 | Exceptional $49,572 |
| Austrians | 98.7 /100 | #103 | Exceptional $49,501 |
| Immigrants | Brazil | 98.6 /100 | #104 | Exceptional $49,463 |
| Immigrants | Western Asia | 98.4 /100 | #105 | Exceptional $49,389 |
| Immigrants | Albania | 98.4 /100 | #106 | Exceptional $49,377 |
| Immigrants | Morocco | 98.4 /100 | #107 | Exceptional $49,368 |
| Palestinians | 98.0 /100 | #108 | Exceptional $49,209 |
| Syrians | 97.1 /100 | #109 | Exceptional $48,934 |