Armenian vs Immigrants from Eritrea Bachelor's Degree
COMPARE
Armenian
Immigrants from Eritrea
Bachelor's Degree
Bachelor's Degree Comparison
Armenians
Immigrants from Eritrea
42.3%
BACHELOR'S DEGREE
99.2/ 100
METRIC RATING
83rd/ 347
METRIC RANK
40.4%
BACHELOR'S DEGREE
94.3/ 100
METRIC RATING
124th/ 347
METRIC RANK
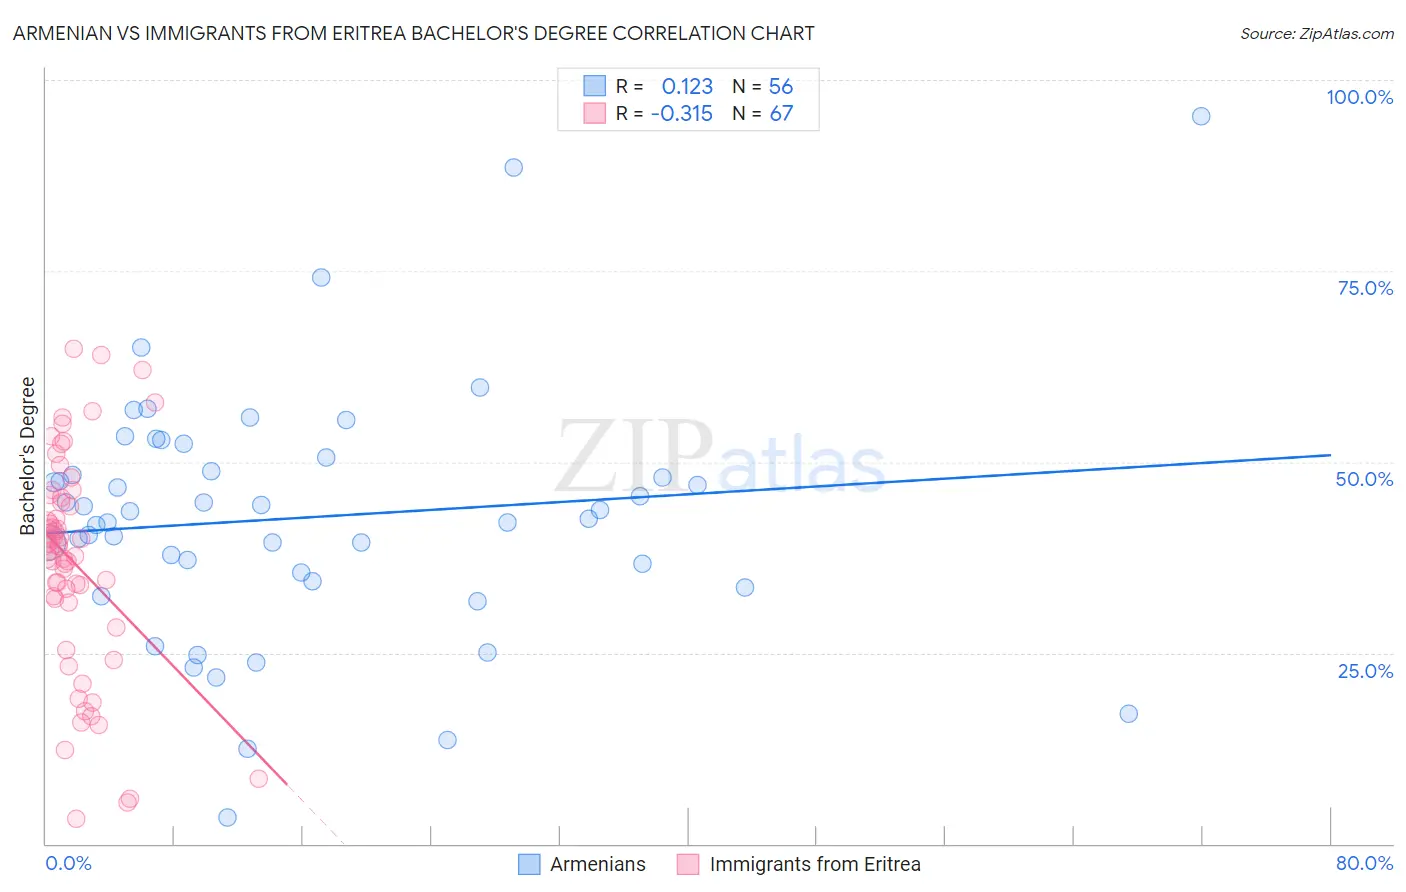
Armenian vs Immigrants from Eritrea Bachelor's Degree Correlation Chart
The statistical analysis conducted on geographies consisting of 310,935,621 people shows a poor positive correlation between the proportion of Armenians and percentage of population with at least bachelor's degree education in the United States with a correlation coefficient (R) of 0.123 and weighted average of 42.3%. Similarly, the statistical analysis conducted on geographies consisting of 104,855,166 people shows a mild negative correlation between the proportion of Immigrants from Eritrea and percentage of population with at least bachelor's degree education in the United States with a correlation coefficient (R) of -0.315 and weighted average of 40.4%, a difference of 4.6%.
Bachelor's Degree Correlation Summary
| Measurement | Armenian | Immigrants from Eritrea |
| Minimum | 3.4% | 3.2% |
| Maximum | 95.3% | 64.8% |
| Range | 91.9% | 61.6% |
| Mean | 42.7% | 36.7% |
| Median | 43.0% | 39.0% |
| Interquartile 25% (IQ1) | 35.0% | 31.5% |
| Interquartile 75% (IQ3) | 49.7% | 45.4% |
| Interquartile Range (IQR) | 14.8% | 13.9% |
| Standard Deviation (Sample) | 16.3% | 14.2% |
| Standard Deviation (Population) | 16.2% | 14.1% |
Similar Demographics by Bachelor's Degree
Demographics Similar to Armenians by Bachelor's Degree
In terms of bachelor's degree, the demographic groups most similar to Armenians are Immigrants from Western Asia (42.3%, a difference of 0.020%), Immigrants from Scotland (42.3%, a difference of 0.030%), Lithuanian (42.2%, a difference of 0.040%), Immigrants from Hungary (42.3%, a difference of 0.10%), and Immigrants from Croatia (42.3%, a difference of 0.11%).
| Demographics | Rating | Rank | Bachelor's Degree |
| Immigrants | Egypt | 99.4 /100 | #76 | Exceptional 42.6% |
| Immigrants | Eastern Europe | 99.4 /100 | #77 | Exceptional 42.5% |
| Immigrants | Ethiopia | 99.4 /100 | #78 | Exceptional 42.5% |
| Immigrants | Lebanon | 99.3 /100 | #79 | Exceptional 42.4% |
| Immigrants | Croatia | 99.2 /100 | #80 | Exceptional 42.3% |
| Immigrants | Hungary | 99.2 /100 | #81 | Exceptional 42.3% |
| Immigrants | Scotland | 99.2 /100 | #82 | Exceptional 42.3% |
| Armenians | 99.2 /100 | #83 | Exceptional 42.3% |
| Immigrants | Western Asia | 99.2 /100 | #84 | Exceptional 42.3% |
| Lithuanians | 99.2 /100 | #85 | Exceptional 42.2% |
| Immigrants | Brazil | 99.2 /100 | #86 | Exceptional 42.2% |
| Carpatho Rusyns | 99.0 /100 | #87 | Exceptional 42.1% |
| Immigrants | Western Europe | 99.0 /100 | #88 | Exceptional 42.0% |
| Greeks | 99.0 /100 | #89 | Exceptional 42.0% |
| Laotians | 98.9 /100 | #90 | Exceptional 42.0% |
Demographics Similar to Immigrants from Eritrea by Bachelor's Degree
In terms of bachelor's degree, the demographic groups most similar to Immigrants from Eritrea are Lebanese (40.4%, a difference of 0.0%), Immigrants from Albania (40.4%, a difference of 0.020%), British (40.4%, a difference of 0.030%), Immigrants from Eastern Africa (40.4%, a difference of 0.080%), and Moroccan (40.5%, a difference of 0.12%).
| Demographics | Rating | Rank | Bachelor's Degree |
| Austrians | 95.5 /100 | #117 | Exceptional 40.6% |
| Croatians | 95.5 /100 | #118 | Exceptional 40.6% |
| Immigrants | Syria | 94.9 /100 | #119 | Exceptional 40.5% |
| Venezuelans | 94.7 /100 | #120 | Exceptional 40.5% |
| Moroccans | 94.6 /100 | #121 | Exceptional 40.5% |
| Immigrants | Albania | 94.4 /100 | #122 | Exceptional 40.4% |
| Lebanese | 94.3 /100 | #123 | Exceptional 40.4% |
| Immigrants | Eritrea | 94.3 /100 | #124 | Exceptional 40.4% |
| British | 94.2 /100 | #125 | Exceptional 40.4% |
| Immigrants | Eastern Africa | 94.1 /100 | #126 | Exceptional 40.4% |
| Immigrants | Jordan | 93.4 /100 | #127 | Exceptional 40.3% |
| Immigrants | Venezuela | 92.9 /100 | #128 | Exceptional 40.2% |
| Serbians | 92.4 /100 | #129 | Exceptional 40.1% |
| Sierra Leoneans | 92.2 /100 | #130 | Exceptional 40.1% |
| Italians | 91.9 /100 | #131 | Exceptional 40.1% |