Armenian vs Immigrants from Eritrea In Labor Force | Age 20-64
COMPARE
Armenian
Immigrants from Eritrea
In Labor Force | Age 20-64
In Labor Force | Age 20-64 Comparison
Armenians
Immigrants from Eritrea
79.5%
IN LABOR FORCE | AGE 20-64
41.4/ 100
METRIC RATING
179th/ 347
METRIC RANK
81.3%
IN LABOR FORCE | AGE 20-64
100.0/ 100
METRIC RATING
12th/ 347
METRIC RANK
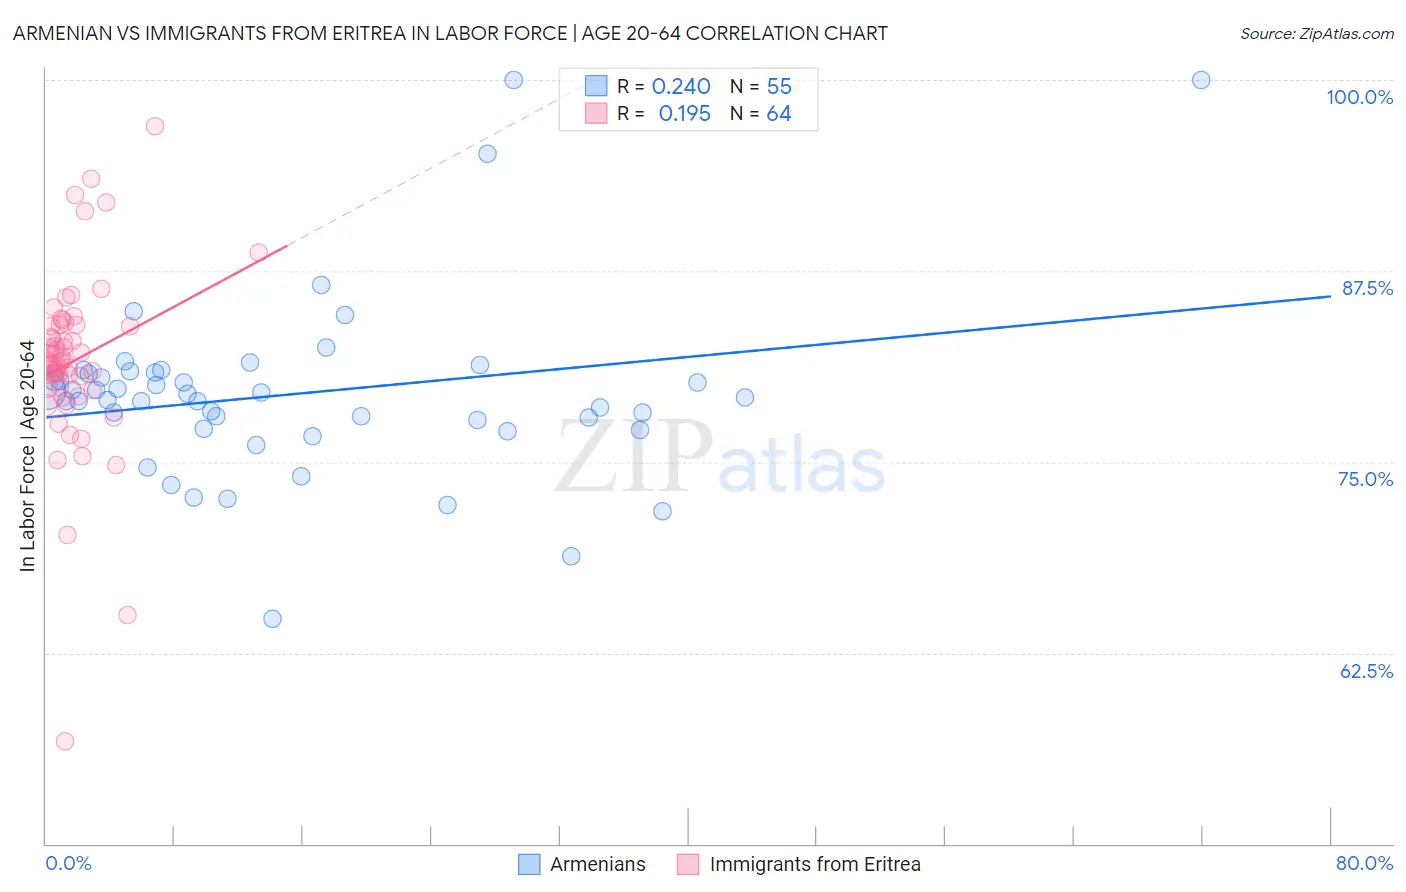
Armenian vs Immigrants from Eritrea In Labor Force | Age 20-64 Correlation Chart
The statistical analysis conducted on geographies consisting of 310,959,496 people shows a weak positive correlation between the proportion of Armenians and labor force participation rate among population between the ages 20 and 64 in the United States with a correlation coefficient (R) of 0.240 and weighted average of 79.5%. Similarly, the statistical analysis conducted on geographies consisting of 104,851,863 people shows a poor positive correlation between the proportion of Immigrants from Eritrea and labor force participation rate among population between the ages 20 and 64 in the United States with a correlation coefficient (R) of 0.195 and weighted average of 81.3%, a difference of 2.2%.
In Labor Force | Age 20-64 Correlation Summary
| Measurement | Armenian | Immigrants from Eritrea |
| Minimum | 64.7% | 56.7% |
| Maximum | 100.0% | 97.0% |
| Range | 35.3% | 40.3% |
| Mean | 79.5% | 81.6% |
| Median | 79.2% | 81.6% |
| Interquartile 25% (IQ1) | 77.1% | 79.9% |
| Interquartile 75% (IQ3) | 80.9% | 83.9% |
| Interquartile Range (IQR) | 3.7% | 4.1% |
| Standard Deviation (Sample) | 5.9% | 5.9% |
| Standard Deviation (Population) | 5.9% | 5.8% |
Similar Demographics by In Labor Force | Age 20-64
Demographics Similar to Armenians by In Labor Force | Age 20-64
In terms of in labor force | age 20-64, the demographic groups most similar to Armenians are Salvadoran (79.5%, a difference of 0.0%), Czechoslovakian (79.5%, a difference of 0.020%), Immigrants from Netherlands (79.5%, a difference of 0.030%), Immigrants from Saudi Arabia (79.5%, a difference of 0.030%), and Cuban (79.5%, a difference of 0.040%).
| Demographics | Rating | Rank | In Labor Force | Age 20-64 |
| Immigrants | Belgium | 53.1 /100 | #172 | Average 79.6% |
| Immigrants | Scotland | 52.4 /100 | #173 | Average 79.6% |
| Syrians | 50.0 /100 | #174 | Average 79.6% |
| Cubans | 46.1 /100 | #175 | Average 79.5% |
| Australians | 46.0 /100 | #176 | Average 79.5% |
| Immigrants | Netherlands | 45.2 /100 | #177 | Average 79.5% |
| Czechoslovakians | 44.3 /100 | #178 | Average 79.5% |
| Armenians | 41.4 /100 | #179 | Average 79.5% |
| Salvadorans | 41.0 /100 | #180 | Average 79.5% |
| Immigrants | Saudi Arabia | 37.7 /100 | #181 | Fair 79.5% |
| Malaysians | 37.1 /100 | #182 | Fair 79.5% |
| Immigrants | Hungary | 36.8 /100 | #183 | Fair 79.5% |
| Finns | 35.9 /100 | #184 | Fair 79.5% |
| Israelis | 34.7 /100 | #185 | Fair 79.5% |
| Northern Europeans | 34.5 /100 | #186 | Fair 79.5% |
Demographics Similar to Immigrants from Eritrea by In Labor Force | Age 20-64
In terms of in labor force | age 20-64, the demographic groups most similar to Immigrants from Eritrea are Immigrants from Eastern Africa (81.3%, a difference of 0.030%), Immigrants from India (81.3%, a difference of 0.030%), Immigrants from Sierra Leone (81.5%, a difference of 0.21%), Cambodian (81.1%, a difference of 0.27%), and Bulgarian (81.1%, a difference of 0.28%).
| Demographics | Rating | Rank | In Labor Force | Age 20-64 |
| Bolivians | 100.0 /100 | #5 | Exceptional 81.7% |
| Somalis | 100.0 /100 | #6 | Exceptional 81.6% |
| Immigrants | Cameroon | 100.0 /100 | #7 | Exceptional 81.6% |
| Immigrants | Somalia | 100.0 /100 | #8 | Exceptional 81.6% |
| Sierra Leoneans | 100.0 /100 | #9 | Exceptional 81.5% |
| Immigrants | Sierra Leone | 100.0 /100 | #10 | Exceptional 81.5% |
| Immigrants | Eastern Africa | 100.0 /100 | #11 | Exceptional 81.3% |
| Immigrants | Eritrea | 100.0 /100 | #12 | Exceptional 81.3% |
| Immigrants | India | 100.0 /100 | #13 | Exceptional 81.3% |
| Cambodians | 100.0 /100 | #14 | Exceptional 81.1% |
| Bulgarians | 100.0 /100 | #15 | Exceptional 81.1% |
| Immigrants | Nepal | 100.0 /100 | #16 | Exceptional 81.1% |
| Norwegians | 100.0 /100 | #17 | Exceptional 81.0% |
| Immigrants | Bulgaria | 100.0 /100 | #18 | Exceptional 81.0% |
| Zimbabweans | 100.0 /100 | #19 | Exceptional 81.0% |