Immigrants from Moldova vs Immigrants from Philippines Median Female Earnings
COMPARE
Immigrants from Moldova
Immigrants from Philippines
Median Female Earnings
Median Female Earnings Comparison
Immigrants from Moldova
Immigrants from Philippines
$42,304
MEDIAN FEMALE EARNINGS
99.6/ 100
METRIC RATING
80th/ 347
METRIC RANK
$41,114
MEDIAN FEMALE EARNINGS
95.0/ 100
METRIC RATING
119th/ 347
METRIC RANK
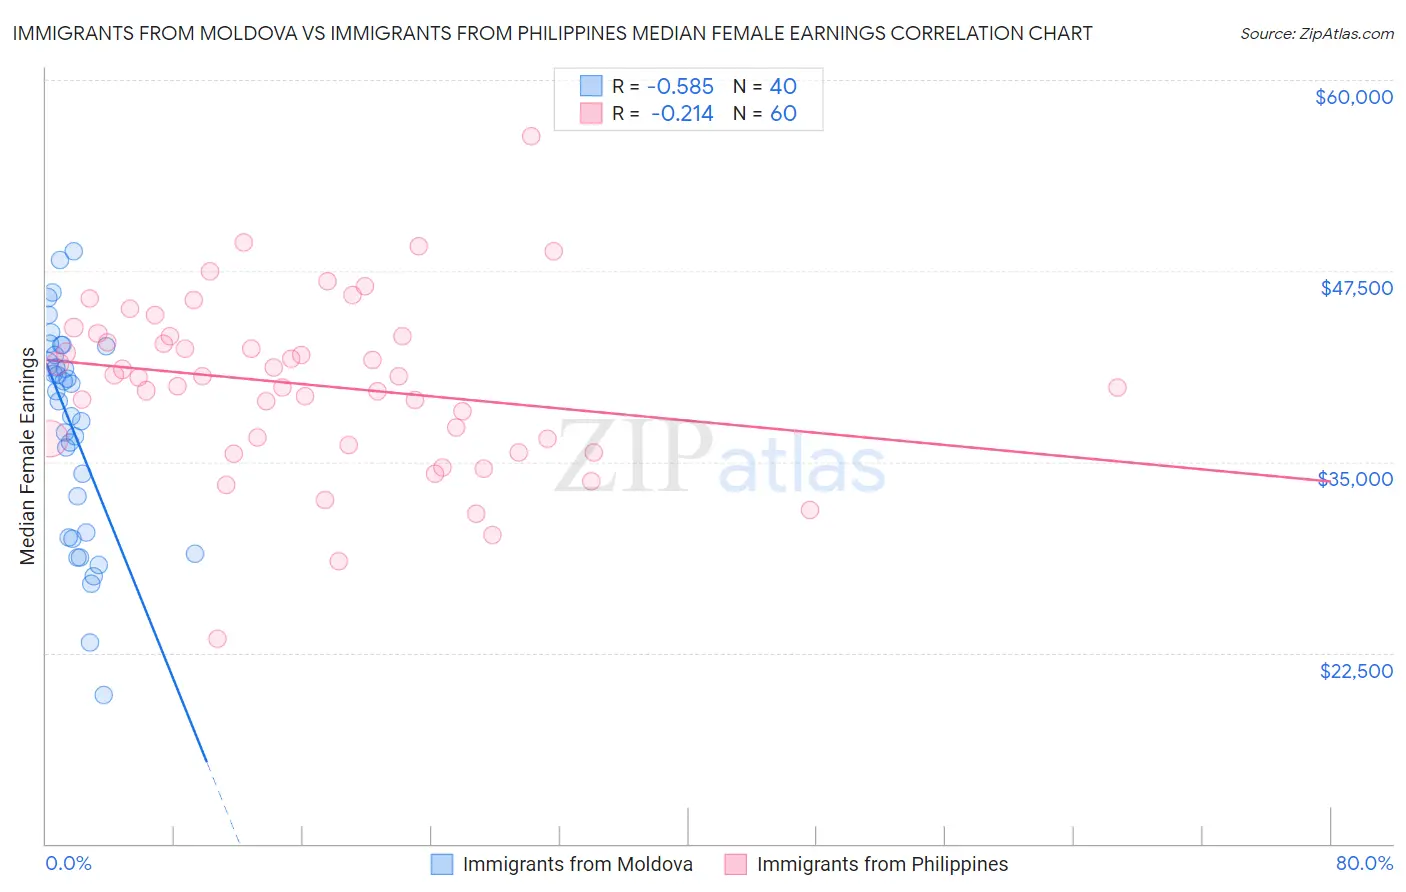
Immigrants from Moldova vs Immigrants from Philippines Median Female Earnings Correlation Chart
The statistical analysis conducted on geographies consisting of 124,390,401 people shows a substantial negative correlation between the proportion of Immigrants from Moldova and median female earnings in the United States with a correlation coefficient (R) of -0.585 and weighted average of $42,304. Similarly, the statistical analysis conducted on geographies consisting of 470,999,138 people shows a weak negative correlation between the proportion of Immigrants from Philippines and median female earnings in the United States with a correlation coefficient (R) of -0.214 and weighted average of $41,114, a difference of 2.9%.
Median Female Earnings Correlation Summary
| Measurement | Immigrants from Moldova | Immigrants from Philippines |
| Minimum | $19,712 | $23,405 |
| Maximum | $48,785 | $56,354 |
| Range | $29,073 | $32,949 |
| Mean | $37,125 | $40,018 |
| Median | $39,287 | $40,572 |
| Interquartile 25% (IQ1) | $30,213 | $36,304 |
| Interquartile 75% (IQ3) | $42,291 | $43,216 |
| Interquartile Range (IQR) | $12,078 | $6,912 |
| Standard Deviation (Sample) | $7,033 | $5,659 |
| Standard Deviation (Population) | $6,945 | $5,612 |
Similar Demographics by Median Female Earnings
Demographics Similar to Immigrants from Moldova by Median Female Earnings
In terms of median female earnings, the demographic groups most similar to Immigrants from Moldova are Immigrants from Southern Europe ($42,275, a difference of 0.070%), Greek ($42,336, a difference of 0.080%), Immigrants from Morocco ($42,229, a difference of 0.18%), Immigrants from Kazakhstan ($42,386, a difference of 0.19%), and Immigrants from Albania ($42,388, a difference of 0.20%).
| Demographics | Rating | Rank | Median Female Earnings |
| Mongolians | 99.7 /100 | #73 | Exceptional $42,542 |
| Immigrants | South Africa | 99.7 /100 | #74 | Exceptional $42,508 |
| New Zealanders | 99.7 /100 | #75 | Exceptional $42,446 |
| Immigrants | Italy | 99.7 /100 | #76 | Exceptional $42,446 |
| Immigrants | Albania | 99.6 /100 | #77 | Exceptional $42,388 |
| Immigrants | Kazakhstan | 99.6 /100 | #78 | Exceptional $42,386 |
| Greeks | 99.6 /100 | #79 | Exceptional $42,336 |
| Immigrants | Moldova | 99.6 /100 | #80 | Exceptional $42,304 |
| Immigrants | Southern Europe | 99.5 /100 | #81 | Exceptional $42,275 |
| Immigrants | Morocco | 99.5 /100 | #82 | Exceptional $42,229 |
| Immigrants | Sierra Leone | 99.5 /100 | #83 | Exceptional $42,214 |
| Armenians | 99.5 /100 | #84 | Exceptional $42,212 |
| Laotians | 99.4 /100 | #85 | Exceptional $42,133 |
| Immigrants | St. Vincent and the Grenadines | 99.3 /100 | #86 | Exceptional $42,108 |
| Lithuanians | 99.3 /100 | #87 | Exceptional $42,108 |
Demographics Similar to Immigrants from Philippines by Median Female Earnings
In terms of median female earnings, the demographic groups most similar to Immigrants from Philippines are Immigrants from Kuwait ($41,055, a difference of 0.15%), Immigrants from Lebanon ($41,183, a difference of 0.17%), Croatian ($40,993, a difference of 0.30%), Immigrants from Jordan ($40,977, a difference of 0.33%), and Guyanese ($40,973, a difference of 0.34%).
| Demographics | Rating | Rank | Median Female Earnings |
| Immigrants | North America | 96.7 /100 | #112 | Exceptional $41,319 |
| Macedonians | 96.4 /100 | #113 | Exceptional $41,286 |
| Immigrants | England | 96.4 /100 | #114 | Exceptional $41,277 |
| Koreans | 96.4 /100 | #115 | Exceptional $41,276 |
| Immigrants | Brazil | 96.4 /100 | #116 | Exceptional $41,273 |
| Barbadians | 96.3 /100 | #117 | Exceptional $41,261 |
| Immigrants | Lebanon | 95.6 /100 | #118 | Exceptional $41,183 |
| Immigrants | Philippines | 95.0 /100 | #119 | Exceptional $41,114 |
| Immigrants | Kuwait | 94.4 /100 | #120 | Exceptional $41,055 |
| Croatians | 93.7 /100 | #121 | Exceptional $40,993 |
| Immigrants | Jordan | 93.5 /100 | #122 | Exceptional $40,977 |
| Guyanese | 93.4 /100 | #123 | Exceptional $40,973 |
| Trinidadians and Tobagonians | 93.2 /100 | #124 | Exceptional $40,958 |
| Austrians | 92.7 /100 | #125 | Exceptional $40,923 |
| Immigrants | Trinidad and Tobago | 92.3 /100 | #126 | Exceptional $40,895 |