Immigrants from Central America vs Immigrants from Philippines Median Female Earnings
COMPARE
Immigrants from Central America
Immigrants from Philippines
Median Female Earnings
Median Female Earnings Comparison
Immigrants from Central America
Immigrants from Philippines
$33,953
MEDIAN FEMALE EARNINGS
0.0/ 100
METRIC RATING
328th/ 347
METRIC RANK
$41,114
MEDIAN FEMALE EARNINGS
95.0/ 100
METRIC RATING
119th/ 347
METRIC RANK
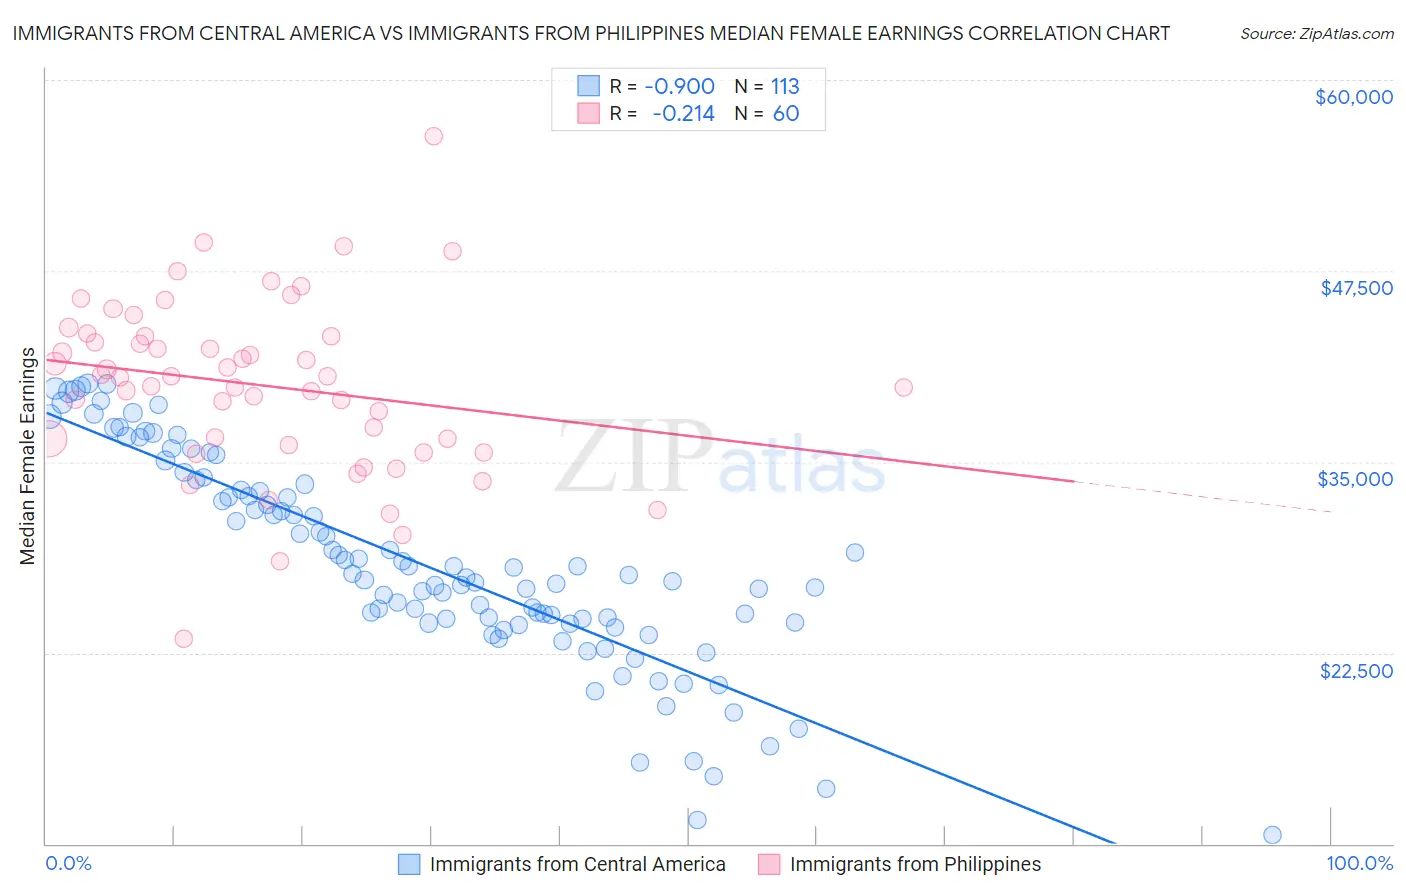
Immigrants from Central America vs Immigrants from Philippines Median Female Earnings Correlation Chart
The statistical analysis conducted on geographies consisting of 535,445,485 people shows a near-perfect negative correlation between the proportion of Immigrants from Central America and median female earnings in the United States with a correlation coefficient (R) of -0.900 and weighted average of $33,953. Similarly, the statistical analysis conducted on geographies consisting of 470,999,138 people shows a weak negative correlation between the proportion of Immigrants from Philippines and median female earnings in the United States with a correlation coefficient (R) of -0.214 and weighted average of $41,114, a difference of 21.1%.
Median Female Earnings Correlation Summary
| Measurement | Immigrants from Central America | Immigrants from Philippines |
| Minimum | $10,532 | $23,405 |
| Maximum | $40,138 | $56,354 |
| Range | $29,606 | $32,949 |
| Mean | $28,383 | $40,018 |
| Median | $27,631 | $40,572 |
| Interquartile 25% (IQ1) | $24,472 | $36,304 |
| Interquartile 75% (IQ3) | $33,368 | $43,216 |
| Interquartile Range (IQR) | $8,895 | $6,912 |
| Standard Deviation (Sample) | $6,771 | $5,659 |
| Standard Deviation (Population) | $6,741 | $5,612 |
Similar Demographics by Median Female Earnings
Demographics Similar to Immigrants from Central America by Median Female Earnings
In terms of median female earnings, the demographic groups most similar to Immigrants from Central America are Hopi ($33,932, a difference of 0.060%), Menominee ($33,894, a difference of 0.17%), Cajun ($34,034, a difference of 0.24%), Kiowa ($34,074, a difference of 0.36%), and Native/Alaskan ($33,806, a difference of 0.43%).
| Demographics | Rating | Rank | Median Female Earnings |
| Hispanics or Latinos | 0.0 /100 | #321 | Tragic $34,421 |
| Chickasaw | 0.0 /100 | #322 | Tragic $34,414 |
| Seminole | 0.0 /100 | #323 | Tragic $34,385 |
| Immigrants | Congo | 0.0 /100 | #324 | Tragic $34,317 |
| Dutch West Indians | 0.0 /100 | #325 | Tragic $34,106 |
| Kiowa | 0.0 /100 | #326 | Tragic $34,074 |
| Cajuns | 0.0 /100 | #327 | Tragic $34,034 |
| Immigrants | Central America | 0.0 /100 | #328 | Tragic $33,953 |
| Hopi | 0.0 /100 | #329 | Tragic $33,932 |
| Menominee | 0.0 /100 | #330 | Tragic $33,894 |
| Natives/Alaskans | 0.0 /100 | #331 | Tragic $33,806 |
| Choctaw | 0.0 /100 | #332 | Tragic $33,775 |
| Mexicans | 0.0 /100 | #333 | Tragic $33,664 |
| Spanish American Indians | 0.0 /100 | #334 | Tragic $33,625 |
| Creek | 0.0 /100 | #335 | Tragic $33,437 |
Demographics Similar to Immigrants from Philippines by Median Female Earnings
In terms of median female earnings, the demographic groups most similar to Immigrants from Philippines are Immigrants from Kuwait ($41,055, a difference of 0.15%), Immigrants from Lebanon ($41,183, a difference of 0.17%), Croatian ($40,993, a difference of 0.30%), Immigrants from Jordan ($40,977, a difference of 0.33%), and Guyanese ($40,973, a difference of 0.34%).
| Demographics | Rating | Rank | Median Female Earnings |
| Immigrants | North America | 96.7 /100 | #112 | Exceptional $41,319 |
| Macedonians | 96.4 /100 | #113 | Exceptional $41,286 |
| Immigrants | England | 96.4 /100 | #114 | Exceptional $41,277 |
| Koreans | 96.4 /100 | #115 | Exceptional $41,276 |
| Immigrants | Brazil | 96.4 /100 | #116 | Exceptional $41,273 |
| Barbadians | 96.3 /100 | #117 | Exceptional $41,261 |
| Immigrants | Lebanon | 95.6 /100 | #118 | Exceptional $41,183 |
| Immigrants | Philippines | 95.0 /100 | #119 | Exceptional $41,114 |
| Immigrants | Kuwait | 94.4 /100 | #120 | Exceptional $41,055 |
| Croatians | 93.7 /100 | #121 | Exceptional $40,993 |
| Immigrants | Jordan | 93.5 /100 | #122 | Exceptional $40,977 |
| Guyanese | 93.4 /100 | #123 | Exceptional $40,973 |
| Trinidadians and Tobagonians | 93.2 /100 | #124 | Exceptional $40,958 |
| Austrians | 92.7 /100 | #125 | Exceptional $40,923 |
| Immigrants | Trinidad and Tobago | 92.3 /100 | #126 | Exceptional $40,895 |