Celtic vs Immigrants from Philippines Median Female Earnings
COMPARE
Celtic
Immigrants from Philippines
Median Female Earnings
Median Female Earnings Comparison
Celtics
Immigrants from Philippines
$38,283
MEDIAN FEMALE EARNINGS
5.0/ 100
METRIC RATING
234th/ 347
METRIC RANK
$41,114
MEDIAN FEMALE EARNINGS
95.0/ 100
METRIC RATING
119th/ 347
METRIC RANK
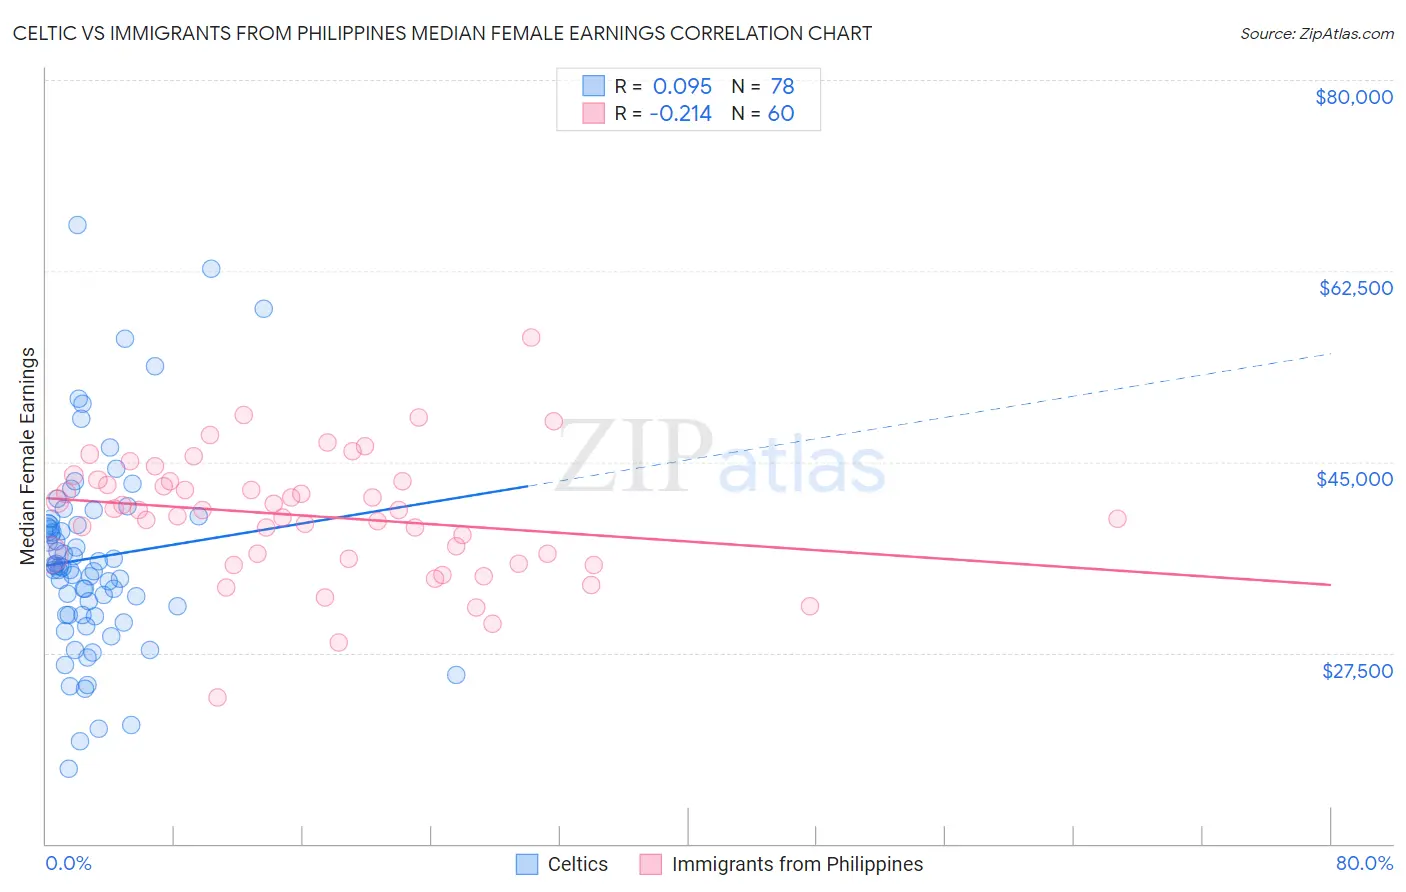
Celtic vs Immigrants from Philippines Median Female Earnings Correlation Chart
The statistical analysis conducted on geographies consisting of 168,839,546 people shows a slight positive correlation between the proportion of Celtics and median female earnings in the United States with a correlation coefficient (R) of 0.095 and weighted average of $38,283. Similarly, the statistical analysis conducted on geographies consisting of 470,999,138 people shows a weak negative correlation between the proportion of Immigrants from Philippines and median female earnings in the United States with a correlation coefficient (R) of -0.214 and weighted average of $41,114, a difference of 7.4%.
Median Female Earnings Correlation Summary
| Measurement | Celtic | Immigrants from Philippines |
| Minimum | $16,819 | $23,405 |
| Maximum | $66,675 | $56,354 |
| Range | $49,856 | $32,949 |
| Mean | $36,202 | $40,018 |
| Median | $35,368 | $40,572 |
| Interquartile 25% (IQ1) | $30,981 | $36,304 |
| Interquartile 75% (IQ3) | $39,367 | $43,216 |
| Interquartile Range (IQR) | $8,386 | $6,912 |
| Standard Deviation (Sample) | $9,110 | $5,659 |
| Standard Deviation (Population) | $9,052 | $5,612 |
Similar Demographics by Median Female Earnings
Demographics Similar to Celtics by Median Female Earnings
In terms of median female earnings, the demographic groups most similar to Celtics are Tongan ($38,288, a difference of 0.010%), Scandinavian ($38,306, a difference of 0.060%), Somali ($38,333, a difference of 0.13%), Basque ($38,352, a difference of 0.18%), and Sudanese ($38,215, a difference of 0.18%).
| Demographics | Rating | Rank | Median Female Earnings |
| Scottish | 6.3 /100 | #227 | Tragic $38,397 |
| Sub-Saharan Africans | 6.2 /100 | #228 | Tragic $38,391 |
| Belgians | 6.1 /100 | #229 | Tragic $38,382 |
| Basques | 5.7 /100 | #230 | Tragic $38,352 |
| Somalis | 5.5 /100 | #231 | Tragic $38,333 |
| Scandinavians | 5.2 /100 | #232 | Tragic $38,306 |
| Tongans | 5.1 /100 | #233 | Tragic $38,288 |
| Celtics | 5.0 /100 | #234 | Tragic $38,283 |
| Sudanese | 4.4 /100 | #235 | Tragic $38,215 |
| Liberians | 4.4 /100 | #236 | Tragic $38,215 |
| Immigrants | Cabo Verde | 4.3 /100 | #237 | Tragic $38,208 |
| Alaska Natives | 4.3 /100 | #238 | Tragic $38,202 |
| English | 4.2 /100 | #239 | Tragic $38,196 |
| Finns | 4.0 /100 | #240 | Tragic $38,173 |
| Spanish | 3.5 /100 | #241 | Tragic $38,098 |
Demographics Similar to Immigrants from Philippines by Median Female Earnings
In terms of median female earnings, the demographic groups most similar to Immigrants from Philippines are Immigrants from Kuwait ($41,055, a difference of 0.15%), Immigrants from Lebanon ($41,183, a difference of 0.17%), Croatian ($40,993, a difference of 0.30%), Immigrants from Jordan ($40,977, a difference of 0.33%), and Guyanese ($40,973, a difference of 0.34%).
| Demographics | Rating | Rank | Median Female Earnings |
| Immigrants | North America | 96.7 /100 | #112 | Exceptional $41,319 |
| Macedonians | 96.4 /100 | #113 | Exceptional $41,286 |
| Immigrants | England | 96.4 /100 | #114 | Exceptional $41,277 |
| Koreans | 96.4 /100 | #115 | Exceptional $41,276 |
| Immigrants | Brazil | 96.4 /100 | #116 | Exceptional $41,273 |
| Barbadians | 96.3 /100 | #117 | Exceptional $41,261 |
| Immigrants | Lebanon | 95.6 /100 | #118 | Exceptional $41,183 |
| Immigrants | Philippines | 95.0 /100 | #119 | Exceptional $41,114 |
| Immigrants | Kuwait | 94.4 /100 | #120 | Exceptional $41,055 |
| Croatians | 93.7 /100 | #121 | Exceptional $40,993 |
| Immigrants | Jordan | 93.5 /100 | #122 | Exceptional $40,977 |
| Guyanese | 93.4 /100 | #123 | Exceptional $40,973 |
| Trinidadians and Tobagonians | 93.2 /100 | #124 | Exceptional $40,958 |
| Austrians | 92.7 /100 | #125 | Exceptional $40,923 |
| Immigrants | Trinidad and Tobago | 92.3 /100 | #126 | Exceptional $40,895 |