Spanish American Indian vs Immigrants from Iran Median Female Earnings
COMPARE
Spanish American Indian
Immigrants from Iran
Median Female Earnings
Median Female Earnings Comparison
Spanish American Indians
Immigrants from Iran
$33,625
MEDIAN FEMALE EARNINGS
0.0/ 100
METRIC RATING
334th/ 347
METRIC RANK
$47,154
MEDIAN FEMALE EARNINGS
100.0/ 100
METRIC RATING
9th/ 347
METRIC RANK
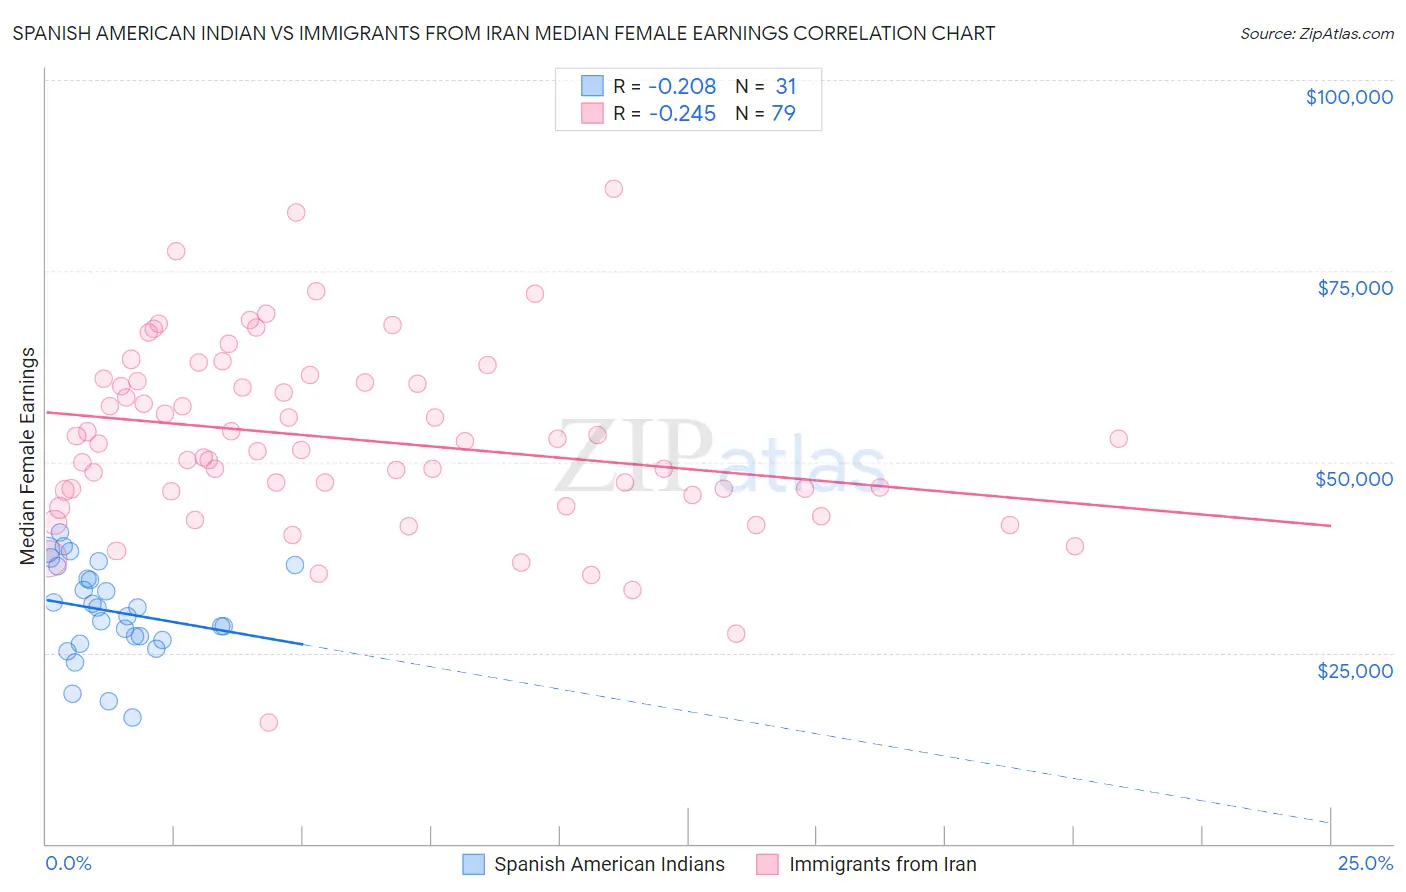
Spanish American Indian vs Immigrants from Iran Median Female Earnings Correlation Chart
The statistical analysis conducted on geographies consisting of 73,144,962 people shows a weak negative correlation between the proportion of Spanish American Indians and median female earnings in the United States with a correlation coefficient (R) of -0.208 and weighted average of $33,625. Similarly, the statistical analysis conducted on geographies consisting of 279,791,483 people shows a weak negative correlation between the proportion of Immigrants from Iran and median female earnings in the United States with a correlation coefficient (R) of -0.245 and weighted average of $47,154, a difference of 40.2%.
Median Female Earnings Correlation Summary
| Measurement | Spanish American Indian | Immigrants from Iran |
| Minimum | $16,510 | $15,864 |
| Maximum | $40,753 | $85,822 |
| Range | $24,243 | $69,958 |
| Mean | $30,468 | $52,976 |
| Median | $30,907 | $52,367 |
| Interquartile 25% (IQ1) | $26,648 | $46,131 |
| Interquartile 75% (IQ3) | $36,401 | $60,507 |
| Interquartile Range (IQR) | $9,753 | $14,376 |
| Standard Deviation (Sample) | $6,157 | $12,151 |
| Standard Deviation (Population) | $6,057 | $12,074 |
Similar Demographics by Median Female Earnings
Demographics Similar to Spanish American Indians by Median Female Earnings
In terms of median female earnings, the demographic groups most similar to Spanish American Indians are Mexican ($33,664, a difference of 0.12%), Choctaw ($33,775, a difference of 0.45%), Native/Alaskan ($33,806, a difference of 0.54%), Creek ($33,437, a difference of 0.56%), and Ottawa ($33,378, a difference of 0.74%).
| Demographics | Rating | Rank | Median Female Earnings |
| Cajuns | 0.0 /100 | #327 | Tragic $34,034 |
| Immigrants | Central America | 0.0 /100 | #328 | Tragic $33,953 |
| Hopi | 0.0 /100 | #329 | Tragic $33,932 |
| Menominee | 0.0 /100 | #330 | Tragic $33,894 |
| Natives/Alaskans | 0.0 /100 | #331 | Tragic $33,806 |
| Choctaw | 0.0 /100 | #332 | Tragic $33,775 |
| Mexicans | 0.0 /100 | #333 | Tragic $33,664 |
| Spanish American Indians | 0.0 /100 | #334 | Tragic $33,625 |
| Creek | 0.0 /100 | #335 | Tragic $33,437 |
| Ottawa | 0.0 /100 | #336 | Tragic $33,378 |
| Yakama | 0.0 /100 | #337 | Tragic $33,354 |
| Immigrants | Cuba | 0.0 /100 | #338 | Tragic $33,291 |
| Immigrants | Mexico | 0.0 /100 | #339 | Tragic $33,236 |
| Tohono O'odham | 0.0 /100 | #340 | Tragic $33,205 |
| Navajo | 0.0 /100 | #341 | Tragic $33,046 |
Demographics Similar to Immigrants from Iran by Median Female Earnings
In terms of median female earnings, the demographic groups most similar to Immigrants from Iran are Immigrants from China ($46,972, a difference of 0.39%), Okinawan ($46,905, a difference of 0.53%), Immigrants from Israel ($46,902, a difference of 0.54%), Iranian ($47,421, a difference of 0.57%), and Thai ($47,577, a difference of 0.90%).
| Demographics | Rating | Rank | Median Female Earnings |
| Filipinos | 100.0 /100 | #2 | Exceptional $49,508 |
| Immigrants | Taiwan | 100.0 /100 | #3 | Exceptional $49,256 |
| Immigrants | India | 100.0 /100 | #4 | Exceptional $48,292 |
| Immigrants | Singapore | 100.0 /100 | #5 | Exceptional $47,986 |
| Immigrants | Ireland | 100.0 /100 | #6 | Exceptional $47,598 |
| Thais | 100.0 /100 | #7 | Exceptional $47,577 |
| Iranians | 100.0 /100 | #8 | Exceptional $47,421 |
| Immigrants | Iran | 100.0 /100 | #9 | Exceptional $47,154 |
| Immigrants | China | 100.0 /100 | #10 | Exceptional $46,972 |
| Okinawans | 100.0 /100 | #11 | Exceptional $46,905 |
| Immigrants | Israel | 100.0 /100 | #12 | Exceptional $46,902 |
| Immigrants | Australia | 100.0 /100 | #13 | Exceptional $46,573 |
| Soviet Union | 100.0 /100 | #14 | Exceptional $46,556 |
| Immigrants | Eastern Asia | 100.0 /100 | #15 | Exceptional $46,502 |
| Indians (Asian) | 100.0 /100 | #16 | Exceptional $46,481 |