Somali vs Immigrants from Iran Median Female Earnings
COMPARE
Somali
Immigrants from Iran
Median Female Earnings
Median Female Earnings Comparison
Somalis
Immigrants from Iran
$38,333
MEDIAN FEMALE EARNINGS
5.5/ 100
METRIC RATING
231st/ 347
METRIC RANK
$47,154
MEDIAN FEMALE EARNINGS
100.0/ 100
METRIC RATING
9th/ 347
METRIC RANK
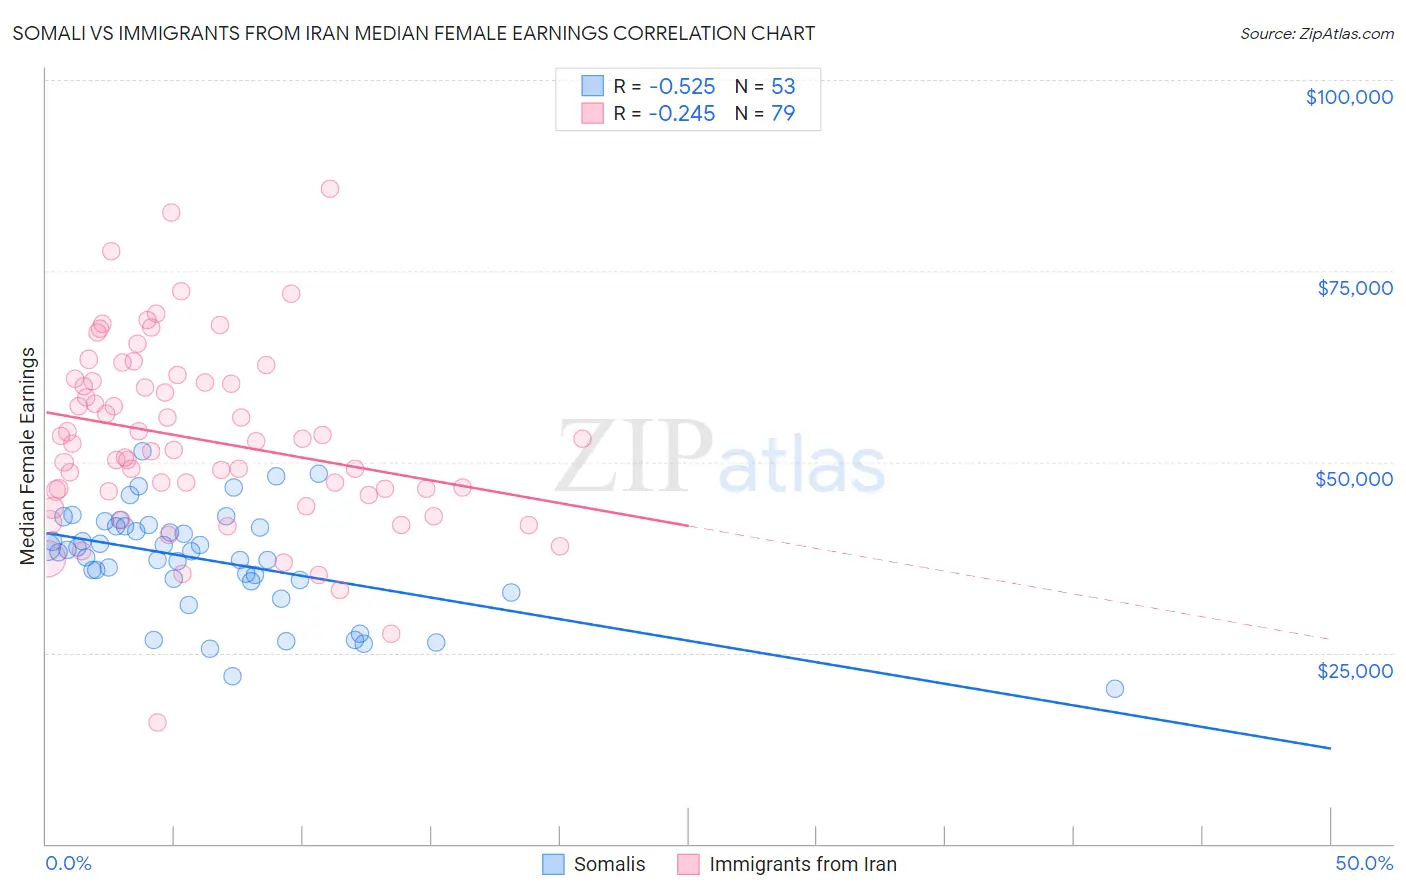
Somali vs Immigrants from Iran Median Female Earnings Correlation Chart
The statistical analysis conducted on geographies consisting of 99,326,973 people shows a substantial negative correlation between the proportion of Somalis and median female earnings in the United States with a correlation coefficient (R) of -0.525 and weighted average of $38,333. Similarly, the statistical analysis conducted on geographies consisting of 279,791,483 people shows a weak negative correlation between the proportion of Immigrants from Iran and median female earnings in the United States with a correlation coefficient (R) of -0.245 and weighted average of $47,154, a difference of 23.0%.
Median Female Earnings Correlation Summary
| Measurement | Somali | Immigrants from Iran |
| Minimum | $20,281 | $15,864 |
| Maximum | $51,368 | $85,822 |
| Range | $31,087 | $69,958 |
| Mean | $37,176 | $52,976 |
| Median | $38,333 | $52,367 |
| Interquartile 25% (IQ1) | $34,463 | $46,131 |
| Interquartile 75% (IQ3) | $41,523 | $60,507 |
| Interquartile Range (IQR) | $7,060 | $14,376 |
| Standard Deviation (Sample) | $6,829 | $12,151 |
| Standard Deviation (Population) | $6,765 | $12,074 |
Similar Demographics by Median Female Earnings
Demographics Similar to Somalis by Median Female Earnings
In terms of median female earnings, the demographic groups most similar to Somalis are Basque ($38,352, a difference of 0.050%), Scandinavian ($38,306, a difference of 0.070%), Tongan ($38,288, a difference of 0.12%), Belgian ($38,382, a difference of 0.13%), and Celtic ($38,283, a difference of 0.13%).
| Demographics | Rating | Rank | Median Female Earnings |
| Native Hawaiians | 7.1 /100 | #224 | Tragic $38,461 |
| French | 7.0 /100 | #225 | Tragic $38,457 |
| French Canadians | 6.8 /100 | #226 | Tragic $38,436 |
| Scottish | 6.3 /100 | #227 | Tragic $38,397 |
| Sub-Saharan Africans | 6.2 /100 | #228 | Tragic $38,391 |
| Belgians | 6.1 /100 | #229 | Tragic $38,382 |
| Basques | 5.7 /100 | #230 | Tragic $38,352 |
| Somalis | 5.5 /100 | #231 | Tragic $38,333 |
| Scandinavians | 5.2 /100 | #232 | Tragic $38,306 |
| Tongans | 5.1 /100 | #233 | Tragic $38,288 |
| Celtics | 5.0 /100 | #234 | Tragic $38,283 |
| Sudanese | 4.4 /100 | #235 | Tragic $38,215 |
| Liberians | 4.4 /100 | #236 | Tragic $38,215 |
| Immigrants | Cabo Verde | 4.3 /100 | #237 | Tragic $38,208 |
| Alaska Natives | 4.3 /100 | #238 | Tragic $38,202 |
Demographics Similar to Immigrants from Iran by Median Female Earnings
In terms of median female earnings, the demographic groups most similar to Immigrants from Iran are Immigrants from China ($46,972, a difference of 0.39%), Okinawan ($46,905, a difference of 0.53%), Immigrants from Israel ($46,902, a difference of 0.54%), Iranian ($47,421, a difference of 0.57%), and Thai ($47,577, a difference of 0.90%).
| Demographics | Rating | Rank | Median Female Earnings |
| Filipinos | 100.0 /100 | #2 | Exceptional $49,508 |
| Immigrants | Taiwan | 100.0 /100 | #3 | Exceptional $49,256 |
| Immigrants | India | 100.0 /100 | #4 | Exceptional $48,292 |
| Immigrants | Singapore | 100.0 /100 | #5 | Exceptional $47,986 |
| Immigrants | Ireland | 100.0 /100 | #6 | Exceptional $47,598 |
| Thais | 100.0 /100 | #7 | Exceptional $47,577 |
| Iranians | 100.0 /100 | #8 | Exceptional $47,421 |
| Immigrants | Iran | 100.0 /100 | #9 | Exceptional $47,154 |
| Immigrants | China | 100.0 /100 | #10 | Exceptional $46,972 |
| Okinawans | 100.0 /100 | #11 | Exceptional $46,905 |
| Immigrants | Israel | 100.0 /100 | #12 | Exceptional $46,902 |
| Immigrants | Australia | 100.0 /100 | #13 | Exceptional $46,573 |
| Soviet Union | 100.0 /100 | #14 | Exceptional $46,556 |
| Immigrants | Eastern Asia | 100.0 /100 | #15 | Exceptional $46,502 |
| Indians (Asian) | 100.0 /100 | #16 | Exceptional $46,481 |