Apache vs Immigrants from Grenada Median Household Income
COMPARE
Apache
Immigrants from Grenada
Median Household Income
Median Household Income Comparison
Apache
Immigrants from Grenada
$70,927
MEDIAN HOUSEHOLD INCOME
0.0/ 100
METRIC RATING
316th/ 347
METRIC RANK
$76,517
MEDIAN HOUSEHOLD INCOME
0.4/ 100
METRIC RATING
261st/ 347
METRIC RANK
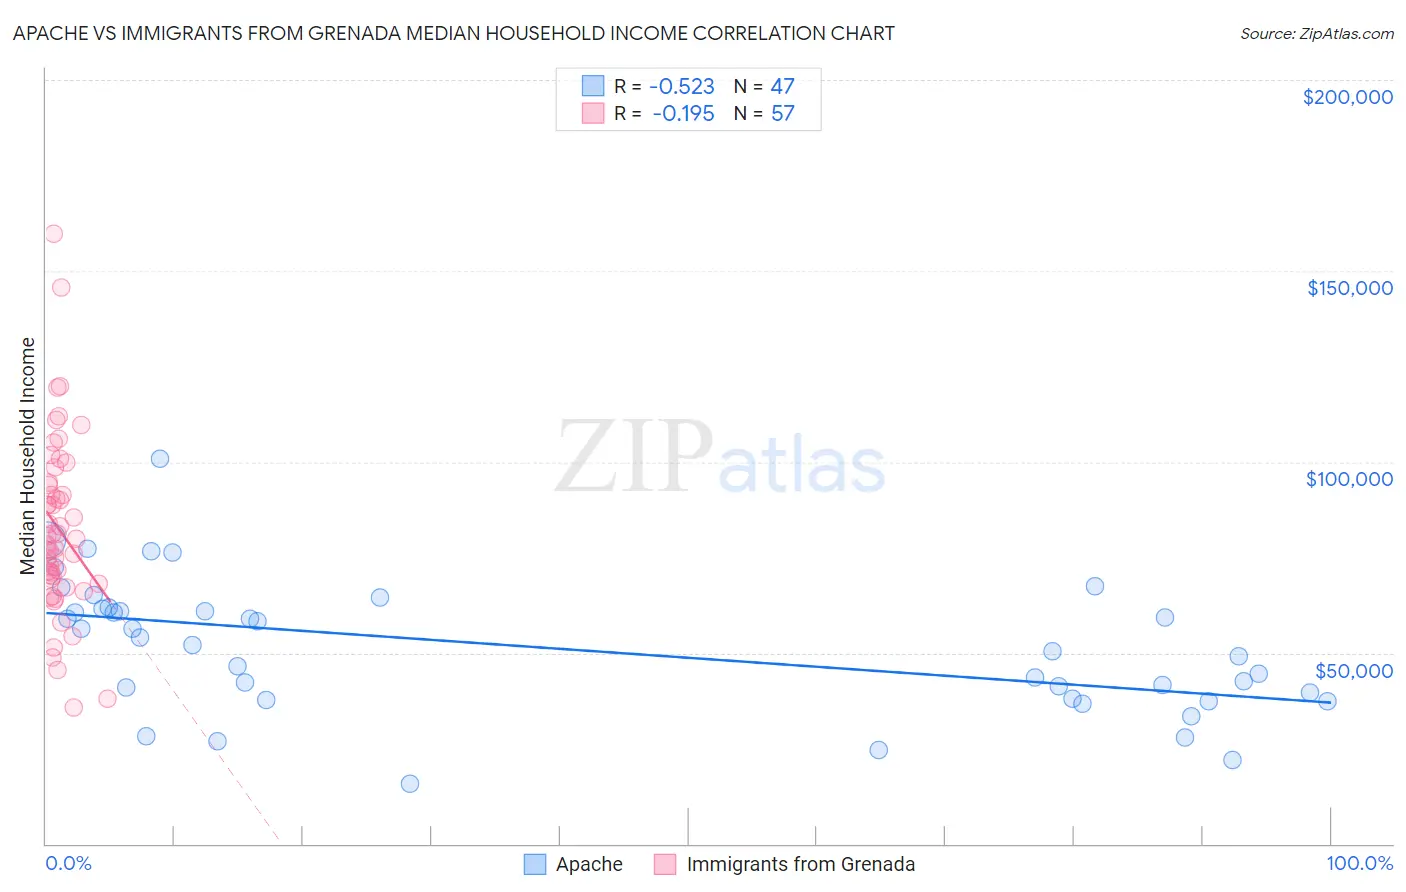
Apache vs Immigrants from Grenada Median Household Income Correlation Chart
The statistical analysis conducted on geographies consisting of 230,997,736 people shows a substantial negative correlation between the proportion of Apache and median household income in the United States with a correlation coefficient (R) of -0.523 and weighted average of $70,927. Similarly, the statistical analysis conducted on geographies consisting of 67,183,202 people shows a poor negative correlation between the proportion of Immigrants from Grenada and median household income in the United States with a correlation coefficient (R) of -0.195 and weighted average of $76,517, a difference of 7.9%.
Median Household Income Correlation Summary
| Measurement | Apache | Immigrants from Grenada |
| Minimum | $15,577 | $35,840 |
| Maximum | $100,781 | $159,688 |
| Range | $85,204 | $123,848 |
| Mean | $51,361 | $82,524 |
| Median | $52,202 | $79,885 |
| Interquartile 25% (IQ1) | $38,125 | $68,699 |
| Interquartile 75% (IQ3) | $61,561 | $94,214 |
| Interquartile Range (IQR) | $23,436 | $25,515 |
| Standard Deviation (Sample) | $17,390 | $23,320 |
| Standard Deviation (Population) | $17,204 | $23,115 |
Similar Demographics by Median Household Income
Demographics Similar to Apache by Median Household Income
In terms of median household income, the demographic groups most similar to Apache are Ottawa ($70,984, a difference of 0.080%), Cajun ($70,605, a difference of 0.46%), Dominican ($71,302, a difference of 0.53%), Chippewa ($70,539, a difference of 0.55%), and Immigrants from Bahamas ($71,349, a difference of 0.59%).
| Demographics | Rating | Rank | Median Household Income |
| Immigrants | Caribbean | 0.0 /100 | #309 | Tragic $71,860 |
| U.S. Virgin Islanders | 0.0 /100 | #310 | Tragic $71,853 |
| Immigrants | Zaire | 0.0 /100 | #311 | Tragic $71,801 |
| Immigrants | Honduras | 0.0 /100 | #312 | Tragic $71,452 |
| Immigrants | Bahamas | 0.0 /100 | #313 | Tragic $71,349 |
| Dominicans | 0.0 /100 | #314 | Tragic $71,302 |
| Ottawa | 0.0 /100 | #315 | Tragic $70,984 |
| Apache | 0.0 /100 | #316 | Tragic $70,927 |
| Cajuns | 0.0 /100 | #317 | Tragic $70,605 |
| Chippewa | 0.0 /100 | #318 | Tragic $70,539 |
| Immigrants | Dominican Republic | 0.0 /100 | #319 | Tragic $70,208 |
| Colville | 0.0 /100 | #320 | Tragic $70,094 |
| Chickasaw | 0.0 /100 | #321 | Tragic $70,005 |
| Choctaw | 0.0 /100 | #322 | Tragic $69,947 |
| Bahamians | 0.0 /100 | #323 | Tragic $69,726 |
Demographics Similar to Immigrants from Grenada by Median Household Income
In terms of median household income, the demographic groups most similar to Immigrants from Grenada are Jamaican ($76,583, a difference of 0.090%), French American Indian ($76,387, a difference of 0.17%), Alaskan Athabascan ($76,383, a difference of 0.18%), Spanish American Indian ($76,670, a difference of 0.20%), and Immigrants from Nicaragua ($76,784, a difference of 0.35%).
| Demographics | Rating | Rank | Median Household Income |
| Sub-Saharan Africans | 0.8 /100 | #254 | Tragic $77,631 |
| Immigrants | Middle Africa | 0.8 /100 | #255 | Tragic $77,559 |
| Belizeans | 0.6 /100 | #256 | Tragic $77,028 |
| Immigrants | Senegal | 0.5 /100 | #257 | Tragic $76,915 |
| Immigrants | Nicaragua | 0.5 /100 | #258 | Tragic $76,784 |
| Spanish American Indians | 0.4 /100 | #259 | Tragic $76,670 |
| Jamaicans | 0.4 /100 | #260 | Tragic $76,583 |
| Immigrants | Grenada | 0.4 /100 | #261 | Tragic $76,517 |
| French American Indians | 0.4 /100 | #262 | Tragic $76,387 |
| Alaskan Athabascans | 0.4 /100 | #263 | Tragic $76,383 |
| Guatemalans | 0.3 /100 | #264 | Tragic $75,961 |
| Immigrants | Belize | 0.3 /100 | #265 | Tragic $75,938 |
| Americans | 0.3 /100 | #266 | Tragic $75,932 |
| German Russians | 0.3 /100 | #267 | Tragic $75,856 |
| Immigrants | Jamaica | 0.3 /100 | #268 | Tragic $75,851 |