Cree vs Immigrants from Grenada Median Household Income
COMPARE
Cree
Immigrants from Grenada
Median Household Income
Median Household Income Comparison
Cree
Immigrants from Grenada
$74,685
MEDIAN HOUSEHOLD INCOME
0.1/ 100
METRIC RATING
283rd/ 347
METRIC RANK
$76,517
MEDIAN HOUSEHOLD INCOME
0.4/ 100
METRIC RATING
261st/ 347
METRIC RANK
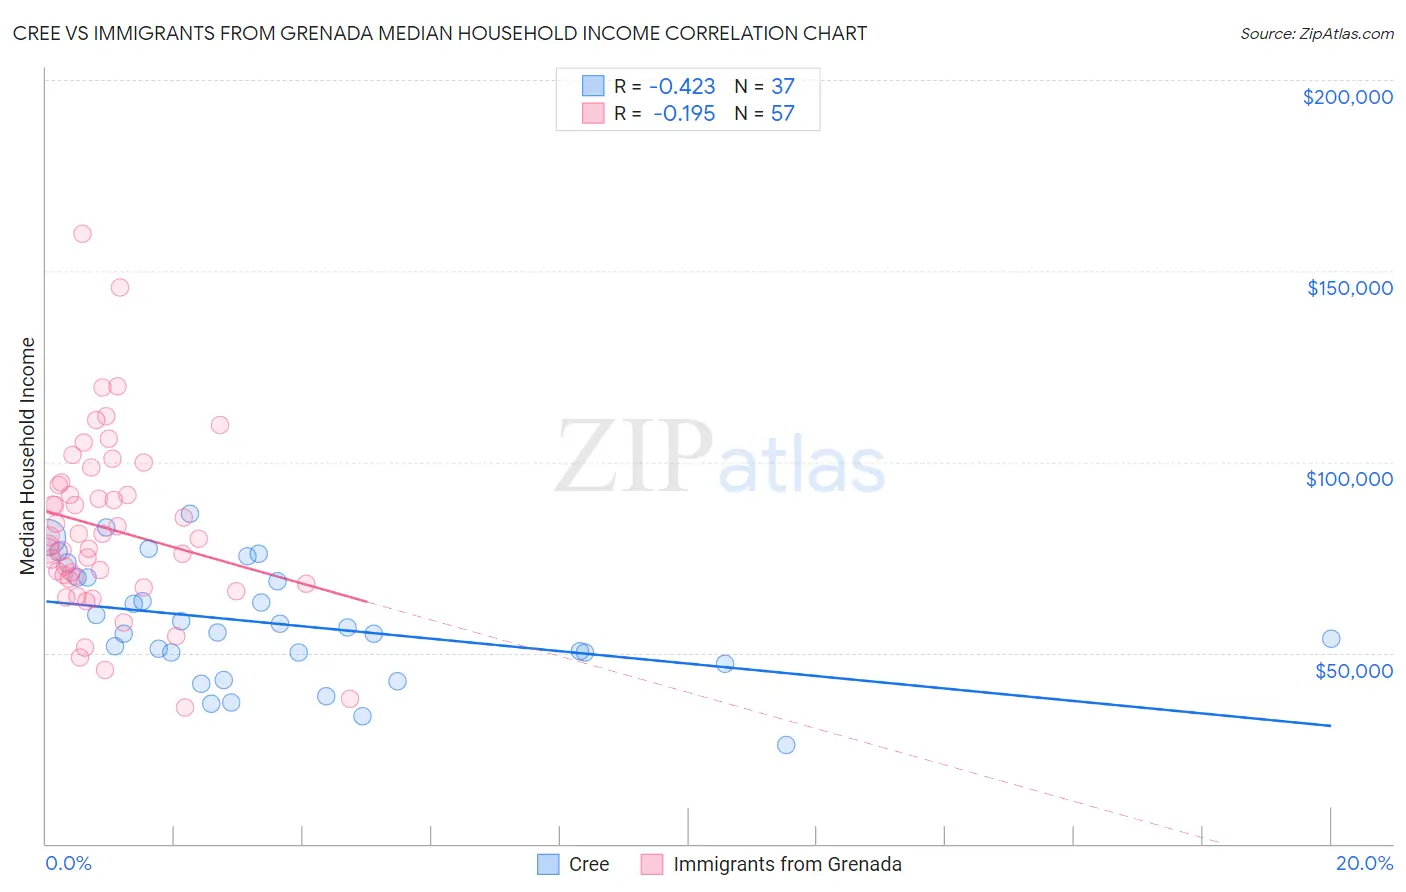
Cree vs Immigrants from Grenada Median Household Income Correlation Chart
The statistical analysis conducted on geographies consisting of 76,206,119 people shows a moderate negative correlation between the proportion of Cree and median household income in the United States with a correlation coefficient (R) of -0.423 and weighted average of $74,685. Similarly, the statistical analysis conducted on geographies consisting of 67,183,202 people shows a poor negative correlation between the proportion of Immigrants from Grenada and median household income in the United States with a correlation coefficient (R) of -0.195 and weighted average of $76,517, a difference of 2.5%.
Median Household Income Correlation Summary
| Measurement | Cree | Immigrants from Grenada |
| Minimum | $25,833 | $35,840 |
| Maximum | $86,509 | $159,688 |
| Range | $60,676 | $123,848 |
| Mean | $57,468 | $82,524 |
| Median | $55,368 | $79,885 |
| Interquartile 25% (IQ1) | $48,609 | $68,699 |
| Interquartile 75% (IQ3) | $69,690 | $94,214 |
| Interquartile Range (IQR) | $21,081 | $25,515 |
| Standard Deviation (Sample) | $14,992 | $23,320 |
| Standard Deviation (Population) | $14,788 | $23,115 |
Similar Demographics by Median Household Income
Demographics Similar to Cree by Median Household Income
In terms of median household income, the demographic groups most similar to Cree are Yaqui ($74,596, a difference of 0.12%), Central American Indian ($74,847, a difference of 0.22%), Immigrants from Liberia ($74,896, a difference of 0.28%), Mexican ($74,399, a difference of 0.39%), and Senegalese ($74,999, a difference of 0.42%).
| Demographics | Rating | Rank | Median Household Income |
| Immigrants | Latin America | 0.2 /100 | #276 | Tragic $75,420 |
| Spanish Americans | 0.2 /100 | #277 | Tragic $75,386 |
| Osage | 0.2 /100 | #278 | Tragic $75,240 |
| Immigrants | Guatemala | 0.2 /100 | #279 | Tragic $75,123 |
| Senegalese | 0.2 /100 | #280 | Tragic $74,999 |
| Immigrants | Liberia | 0.1 /100 | #281 | Tragic $74,896 |
| Central American Indians | 0.1 /100 | #282 | Tragic $74,847 |
| Cree | 0.1 /100 | #283 | Tragic $74,685 |
| Yaqui | 0.1 /100 | #284 | Tragic $74,596 |
| Mexicans | 0.1 /100 | #285 | Tragic $74,399 |
| Immigrants | Somalia | 0.1 /100 | #286 | Tragic $74,300 |
| Iroquois | 0.1 /100 | #287 | Tragic $74,279 |
| Immigrants | Central America | 0.1 /100 | #288 | Tragic $74,217 |
| Fijians | 0.1 /100 | #289 | Tragic $74,205 |
| Bangladeshis | 0.1 /100 | #290 | Tragic $74,112 |
Demographics Similar to Immigrants from Grenada by Median Household Income
In terms of median household income, the demographic groups most similar to Immigrants from Grenada are Jamaican ($76,583, a difference of 0.090%), French American Indian ($76,387, a difference of 0.17%), Alaskan Athabascan ($76,383, a difference of 0.18%), Spanish American Indian ($76,670, a difference of 0.20%), and Immigrants from Nicaragua ($76,784, a difference of 0.35%).
| Demographics | Rating | Rank | Median Household Income |
| Sub-Saharan Africans | 0.8 /100 | #254 | Tragic $77,631 |
| Immigrants | Middle Africa | 0.8 /100 | #255 | Tragic $77,559 |
| Belizeans | 0.6 /100 | #256 | Tragic $77,028 |
| Immigrants | Senegal | 0.5 /100 | #257 | Tragic $76,915 |
| Immigrants | Nicaragua | 0.5 /100 | #258 | Tragic $76,784 |
| Spanish American Indians | 0.4 /100 | #259 | Tragic $76,670 |
| Jamaicans | 0.4 /100 | #260 | Tragic $76,583 |
| Immigrants | Grenada | 0.4 /100 | #261 | Tragic $76,517 |
| French American Indians | 0.4 /100 | #262 | Tragic $76,387 |
| Alaskan Athabascans | 0.4 /100 | #263 | Tragic $76,383 |
| Guatemalans | 0.3 /100 | #264 | Tragic $75,961 |
| Immigrants | Belize | 0.3 /100 | #265 | Tragic $75,938 |
| Americans | 0.3 /100 | #266 | Tragic $75,932 |
| German Russians | 0.3 /100 | #267 | Tragic $75,856 |
| Immigrants | Jamaica | 0.3 /100 | #268 | Tragic $75,851 |