Apache vs Immigrants from Cameroon Median Household Income
COMPARE
Apache
Immigrants from Cameroon
Median Household Income
Median Household Income Comparison
Apache
Immigrants from Cameroon
$70,927
MEDIAN HOUSEHOLD INCOME
0.0/ 100
METRIC RATING
316th/ 347
METRIC RANK
$85,314
MEDIAN HOUSEHOLD INCOME
53.4/ 100
METRIC RATING
173rd/ 347
METRIC RANK
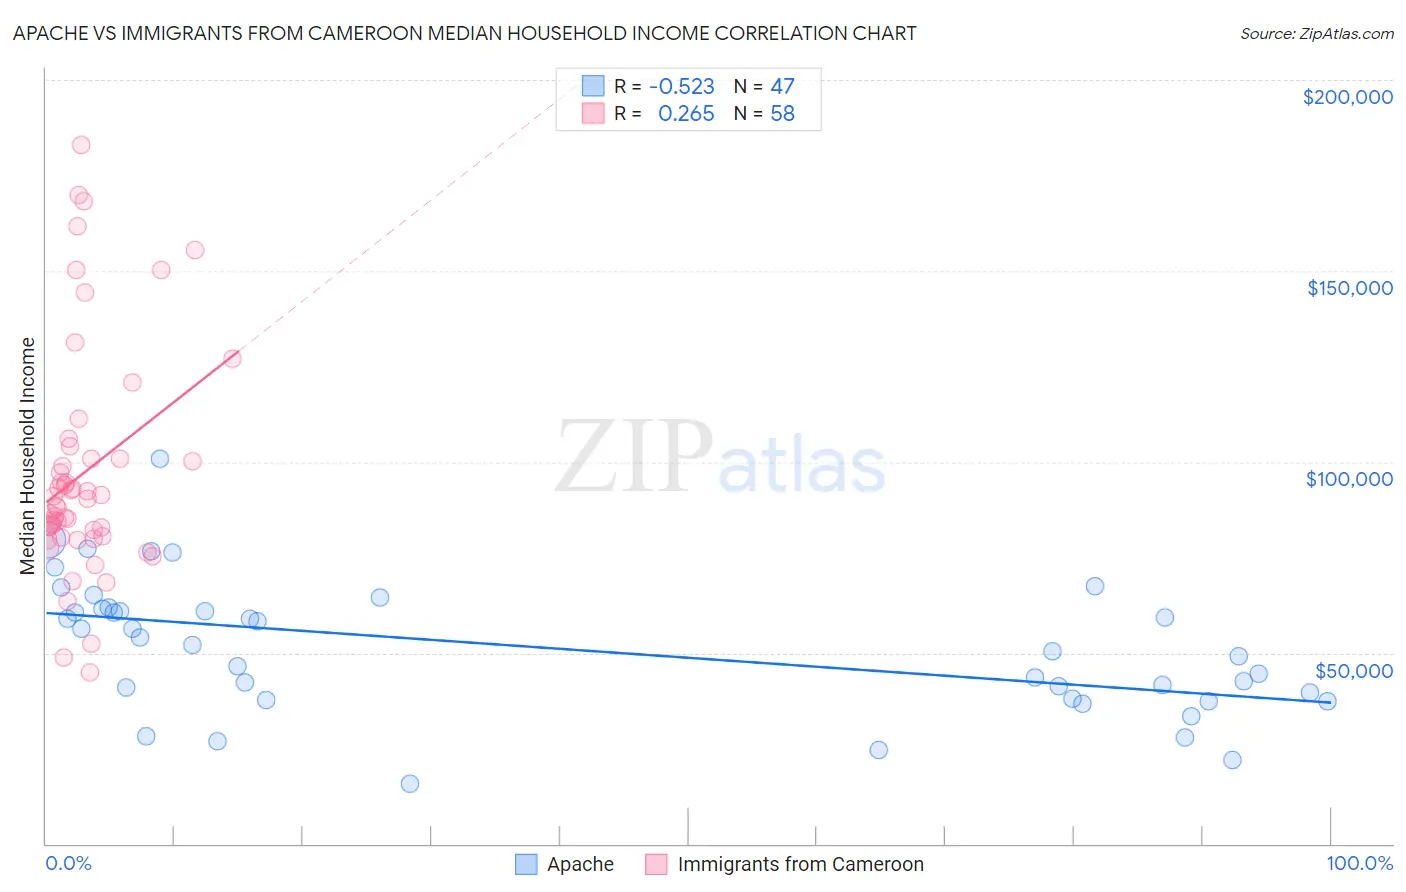
Apache vs Immigrants from Cameroon Median Household Income Correlation Chart
The statistical analysis conducted on geographies consisting of 230,997,736 people shows a substantial negative correlation between the proportion of Apache and median household income in the United States with a correlation coefficient (R) of -0.523 and weighted average of $70,927. Similarly, the statistical analysis conducted on geographies consisting of 130,731,775 people shows a weak positive correlation between the proportion of Immigrants from Cameroon and median household income in the United States with a correlation coefficient (R) of 0.265 and weighted average of $85,314, a difference of 20.3%.
Median Household Income Correlation Summary
| Measurement | Apache | Immigrants from Cameroon |
| Minimum | $15,577 | $44,950 |
| Maximum | $100,781 | $182,977 |
| Range | $85,204 | $138,027 |
| Mean | $51,361 | $97,309 |
| Median | $52,202 | $89,399 |
| Interquartile 25% (IQ1) | $38,125 | $80,569 |
| Interquartile 75% (IQ3) | $61,561 | $100,974 |
| Interquartile Range (IQR) | $23,436 | $20,405 |
| Standard Deviation (Sample) | $17,390 | $30,114 |
| Standard Deviation (Population) | $17,204 | $29,854 |
Similar Demographics by Median Household Income
Demographics Similar to Apache by Median Household Income
In terms of median household income, the demographic groups most similar to Apache are Ottawa ($70,984, a difference of 0.080%), Cajun ($70,605, a difference of 0.46%), Dominican ($71,302, a difference of 0.53%), Chippewa ($70,539, a difference of 0.55%), and Immigrants from Bahamas ($71,349, a difference of 0.59%).
| Demographics | Rating | Rank | Median Household Income |
| Immigrants | Caribbean | 0.0 /100 | #309 | Tragic $71,860 |
| U.S. Virgin Islanders | 0.0 /100 | #310 | Tragic $71,853 |
| Immigrants | Zaire | 0.0 /100 | #311 | Tragic $71,801 |
| Immigrants | Honduras | 0.0 /100 | #312 | Tragic $71,452 |
| Immigrants | Bahamas | 0.0 /100 | #313 | Tragic $71,349 |
| Dominicans | 0.0 /100 | #314 | Tragic $71,302 |
| Ottawa | 0.0 /100 | #315 | Tragic $70,984 |
| Apache | 0.0 /100 | #316 | Tragic $70,927 |
| Cajuns | 0.0 /100 | #317 | Tragic $70,605 |
| Chippewa | 0.0 /100 | #318 | Tragic $70,539 |
| Immigrants | Dominican Republic | 0.0 /100 | #319 | Tragic $70,208 |
| Colville | 0.0 /100 | #320 | Tragic $70,094 |
| Chickasaw | 0.0 /100 | #321 | Tragic $70,005 |
| Choctaw | 0.0 /100 | #322 | Tragic $69,947 |
| Bahamians | 0.0 /100 | #323 | Tragic $69,726 |
Demographics Similar to Immigrants from Cameroon by Median Household Income
In terms of median household income, the demographic groups most similar to Immigrants from Cameroon are Scottish ($85,101, a difference of 0.25%), Slovene ($85,562, a difference of 0.29%), Immigrants from Costa Rica ($85,054, a difference of 0.31%), Alsatian ($85,053, a difference of 0.31%), and Immigrants from Eritrea ($85,025, a difference of 0.34%).
| Demographics | Rating | Rank | Median Household Income |
| Scandinavians | 65.1 /100 | #166 | Good $86,073 |
| Immigrants | Immigrants | 61.3 /100 | #167 | Good $85,818 |
| Icelanders | 61.0 /100 | #168 | Good $85,797 |
| Colombians | 59.7 /100 | #169 | Average $85,716 |
| Swiss | 59.2 /100 | #170 | Average $85,681 |
| Immigrants | South America | 58.1 /100 | #171 | Average $85,611 |
| Slovenes | 57.4 /100 | #172 | Average $85,562 |
| Immigrants | Cameroon | 53.4 /100 | #173 | Average $85,314 |
| Scottish | 50.0 /100 | #174 | Average $85,101 |
| Immigrants | Costa Rica | 49.2 /100 | #175 | Average $85,054 |
| Alsatians | 49.2 /100 | #176 | Average $85,053 |
| Immigrants | Eritrea | 48.8 /100 | #177 | Average $85,025 |
| Czechoslovakians | 47.8 /100 | #178 | Average $84,965 |
| English | 47.0 /100 | #179 | Average $84,915 |
| Immigrants | Portugal | 44.2 /100 | #180 | Average $84,740 |