Apache vs Arab Median Household Income
COMPARE
Apache
Arab
Median Household Income
Median Household Income Comparison
Apache
Arabs
$70,927
MEDIAN HOUSEHOLD INCOME
0.0/ 100
METRIC RATING
316th/ 347
METRIC RANK
$88,398
MEDIAN HOUSEHOLD INCOME
89.2/ 100
METRIC RATING
138th/ 347
METRIC RANK
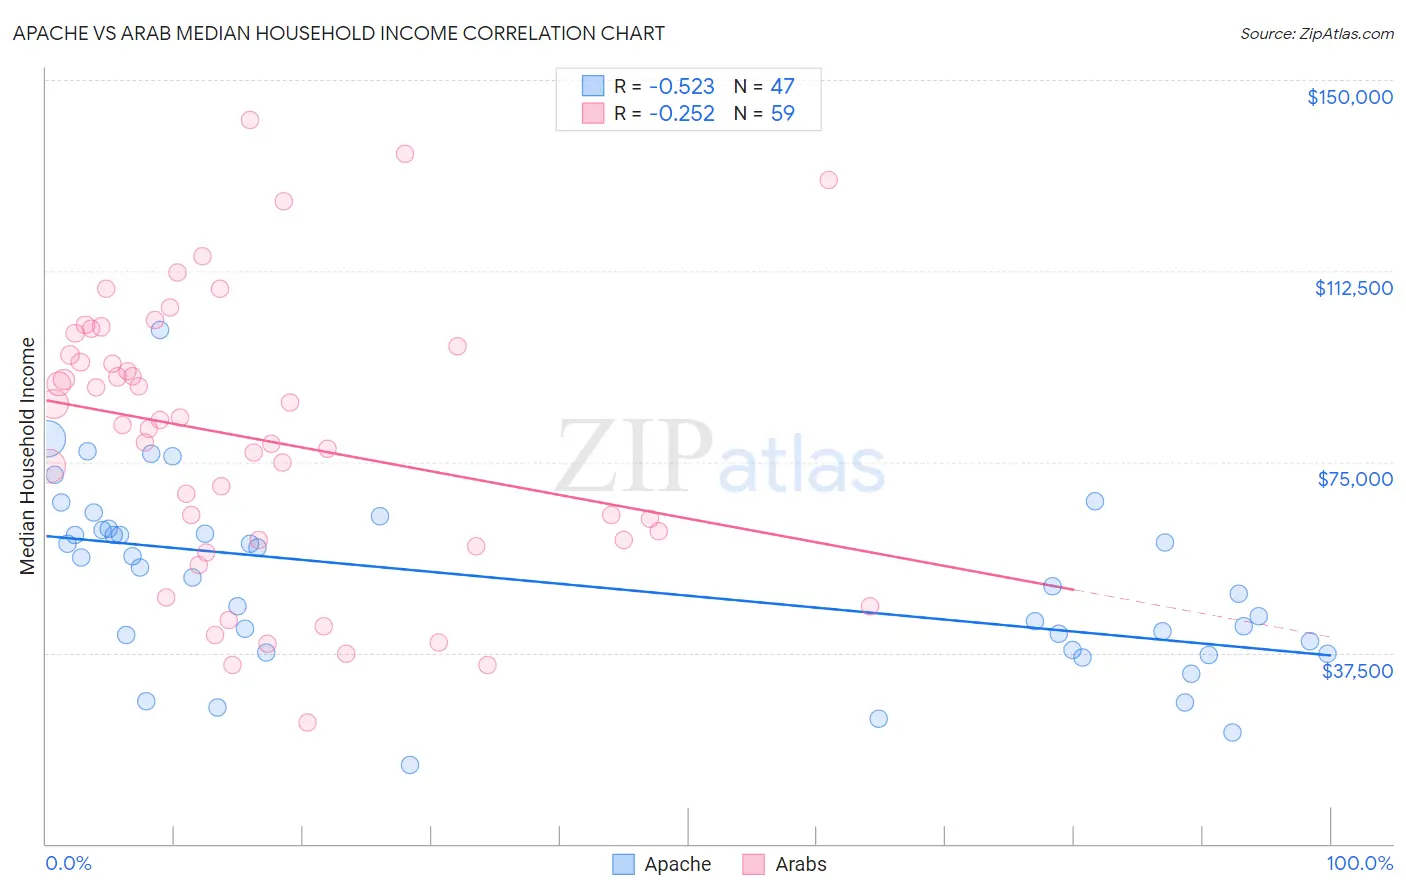
Apache vs Arab Median Household Income Correlation Chart
The statistical analysis conducted on geographies consisting of 230,997,736 people shows a substantial negative correlation between the proportion of Apache and median household income in the United States with a correlation coefficient (R) of -0.523 and weighted average of $70,927. Similarly, the statistical analysis conducted on geographies consisting of 486,242,528 people shows a weak negative correlation between the proportion of Arabs and median household income in the United States with a correlation coefficient (R) of -0.252 and weighted average of $88,398, a difference of 24.6%.
Median Household Income Correlation Summary
| Measurement | Apache | Arab |
| Minimum | $15,577 | $23,929 |
| Maximum | $100,781 | $142,260 |
| Range | $85,204 | $118,331 |
| Mean | $51,361 | $79,535 |
| Median | $52,202 | $82,260 |
| Interquartile 25% (IQ1) | $38,125 | $59,535 |
| Interquartile 75% (IQ3) | $61,561 | $97,787 |
| Interquartile Range (IQR) | $23,436 | $38,252 |
| Standard Deviation (Sample) | $17,390 | $27,234 |
| Standard Deviation (Population) | $17,204 | $27,002 |
Similar Demographics by Median Household Income
Demographics Similar to Apache by Median Household Income
In terms of median household income, the demographic groups most similar to Apache are Ottawa ($70,984, a difference of 0.080%), Cajun ($70,605, a difference of 0.46%), Dominican ($71,302, a difference of 0.53%), Chippewa ($70,539, a difference of 0.55%), and Immigrants from Bahamas ($71,349, a difference of 0.59%).
| Demographics | Rating | Rank | Median Household Income |
| Immigrants | Caribbean | 0.0 /100 | #309 | Tragic $71,860 |
| U.S. Virgin Islanders | 0.0 /100 | #310 | Tragic $71,853 |
| Immigrants | Zaire | 0.0 /100 | #311 | Tragic $71,801 |
| Immigrants | Honduras | 0.0 /100 | #312 | Tragic $71,452 |
| Immigrants | Bahamas | 0.0 /100 | #313 | Tragic $71,349 |
| Dominicans | 0.0 /100 | #314 | Tragic $71,302 |
| Ottawa | 0.0 /100 | #315 | Tragic $70,984 |
| Apache | 0.0 /100 | #316 | Tragic $70,927 |
| Cajuns | 0.0 /100 | #317 | Tragic $70,605 |
| Chippewa | 0.0 /100 | #318 | Tragic $70,539 |
| Immigrants | Dominican Republic | 0.0 /100 | #319 | Tragic $70,208 |
| Colville | 0.0 /100 | #320 | Tragic $70,094 |
| Chickasaw | 0.0 /100 | #321 | Tragic $70,005 |
| Choctaw | 0.0 /100 | #322 | Tragic $69,947 |
| Bahamians | 0.0 /100 | #323 | Tragic $69,726 |
Demographics Similar to Arabs by Median Household Income
In terms of median household income, the demographic groups most similar to Arabs are Immigrants from Chile ($88,388, a difference of 0.010%), Sierra Leonean ($88,463, a difference of 0.070%), Polish ($88,472, a difference of 0.080%), Immigrants from Sierra Leone ($88,498, a difference of 0.11%), and Swedish ($88,524, a difference of 0.14%).
| Demographics | Rating | Rank | Median Household Income |
| Immigrants | Syria | 91.4 /100 | #131 | Exceptional $88,792 |
| Europeans | 91.2 /100 | #132 | Exceptional $88,751 |
| Immigrants | Ethiopia | 90.9 /100 | #133 | Exceptional $88,687 |
| Swedes | 90.0 /100 | #134 | Exceptional $88,524 |
| Immigrants | Sierra Leone | 89.9 /100 | #135 | Excellent $88,498 |
| Poles | 89.7 /100 | #136 | Excellent $88,472 |
| Sierra Leoneans | 89.6 /100 | #137 | Excellent $88,463 |
| Arabs | 89.2 /100 | #138 | Excellent $88,398 |
| Immigrants | Chile | 89.2 /100 | #139 | Excellent $88,388 |
| Lebanese | 87.2 /100 | #140 | Excellent $88,091 |
| Immigrants | Morocco | 86.0 /100 | #141 | Excellent $87,930 |
| Canadians | 84.7 /100 | #142 | Excellent $87,769 |
| Danes | 83.9 /100 | #143 | Excellent $87,676 |
| Serbians | 83.0 /100 | #144 | Excellent $87,572 |
| Ugandans | 82.9 /100 | #145 | Excellent $87,557 |