Nonimmigrants vs Immigrants from Grenada Median Household Income
COMPARE
Nonimmigrants
Immigrants from Grenada
Median Household Income
Median Household Income Comparison
Nonimmigrants
Immigrants from Grenada
$79,429
MEDIAN HOUSEHOLD INCOME
2.6/ 100
METRIC RATING
241st/ 347
METRIC RANK
$76,517
MEDIAN HOUSEHOLD INCOME
0.4/ 100
METRIC RATING
261st/ 347
METRIC RANK
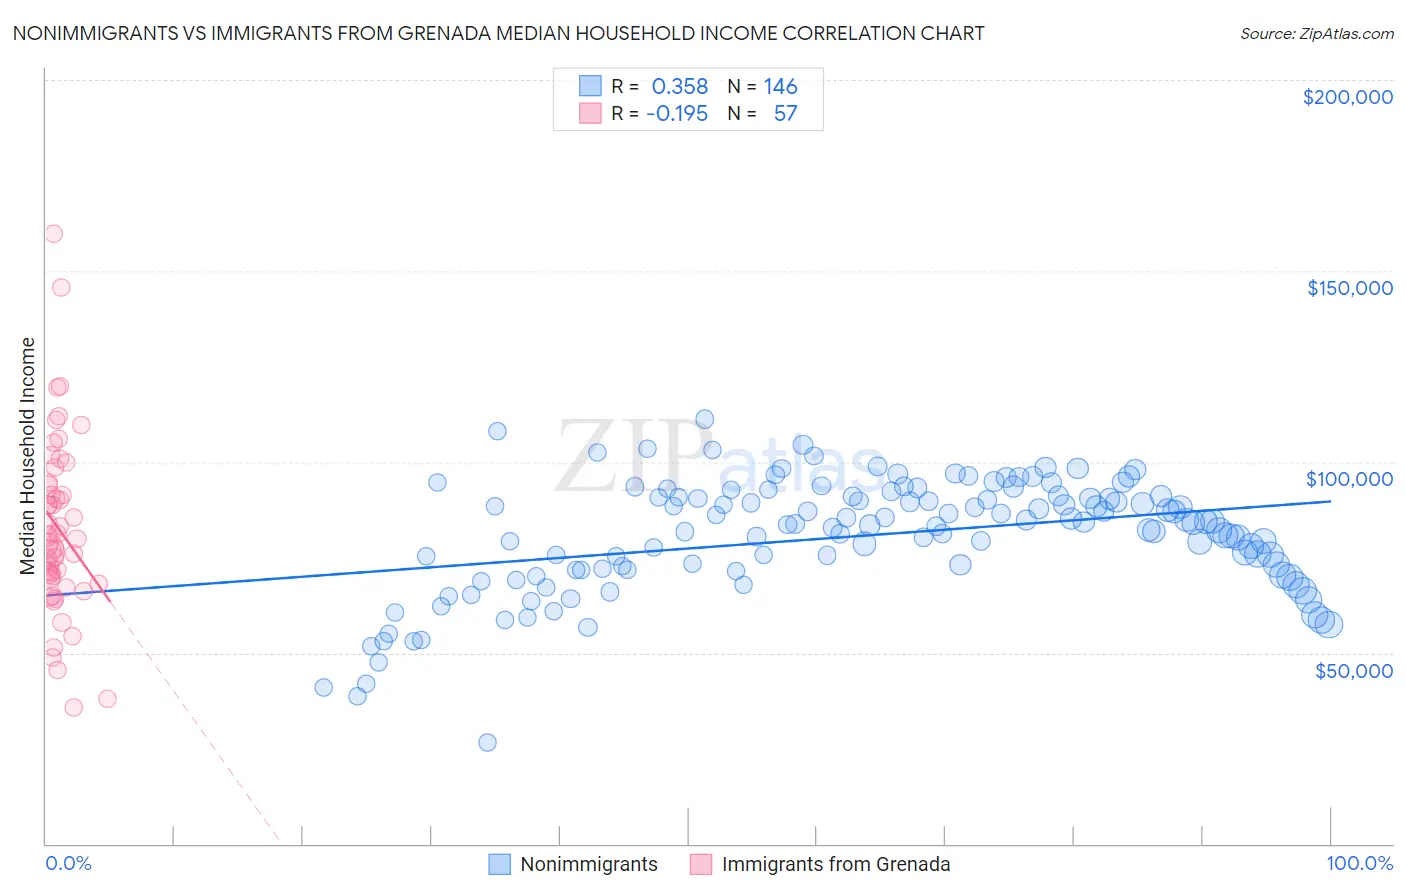
Nonimmigrants vs Immigrants from Grenada Median Household Income Correlation Chart
The statistical analysis conducted on geographies consisting of 582,891,477 people shows a mild positive correlation between the proportion of Nonimmigrants and median household income in the United States with a correlation coefficient (R) of 0.358 and weighted average of $79,429. Similarly, the statistical analysis conducted on geographies consisting of 67,183,202 people shows a poor negative correlation between the proportion of Immigrants from Grenada and median household income in the United States with a correlation coefficient (R) of -0.195 and weighted average of $76,517, a difference of 3.8%.
Median Household Income Correlation Summary
| Measurement | Nonimmigrants | Immigrants from Grenada |
| Minimum | $26,558 | $35,840 |
| Maximum | $111,218 | $159,688 |
| Range | $84,660 | $123,848 |
| Mean | $80,540 | $82,524 |
| Median | $83,608 | $79,885 |
| Interquartile 25% (IQ1) | $71,762 | $68,699 |
| Interquartile 75% (IQ3) | $90,776 | $94,214 |
| Interquartile Range (IQR) | $19,014 | $25,515 |
| Standard Deviation (Sample) | $15,013 | $23,320 |
| Standard Deviation (Population) | $14,961 | $23,115 |
Demographics Similar to Nonimmigrants and Immigrants from Grenada by Median Household Income
In terms of median household income, the demographic groups most similar to Nonimmigrants are Immigrants from Sudan ($79,103, a difference of 0.41%), Immigrants from Barbados ($78,989, a difference of 0.56%), Marshallese ($78,930, a difference of 0.63%), Inupiat ($78,841, a difference of 0.75%), and Central American ($78,803, a difference of 0.80%). Similarly, the demographic groups most similar to Immigrants from Grenada are Jamaican ($76,583, a difference of 0.090%), Spanish American Indian ($76,670, a difference of 0.20%), Immigrants from Nicaragua ($76,784, a difference of 0.35%), Immigrants from Senegal ($76,915, a difference of 0.52%), and Belizean ($77,028, a difference of 0.67%).
| Demographics | Rating | Rank | Median Household Income |
| Immigrants | Nonimmigrants | 2.6 /100 | #241 | Tragic $79,429 |
| Immigrants | Sudan | 2.1 /100 | #242 | Tragic $79,103 |
| Immigrants | Barbados | 1.9 /100 | #243 | Tragic $78,989 |
| Marshallese | 1.9 /100 | #244 | Tragic $78,930 |
| Inupiat | 1.8 /100 | #245 | Tragic $78,841 |
| Central Americans | 1.7 /100 | #246 | Tragic $78,803 |
| Immigrants | Burma/Myanmar | 1.6 /100 | #247 | Tragic $78,682 |
| Sudanese | 1.5 /100 | #248 | Tragic $78,529 |
| West Indians | 1.4 /100 | #249 | Tragic $78,455 |
| Immigrants | Laos | 1.3 /100 | #250 | Tragic $78,327 |
| Mexican American Indians | 1.2 /100 | #251 | Tragic $78,166 |
| Immigrants | West Indies | 1.0 /100 | #252 | Tragic $77,956 |
| Immigrants | St. Vincent and the Grenadines | 0.9 /100 | #253 | Tragic $77,690 |
| Sub-Saharan Africans | 0.8 /100 | #254 | Tragic $77,631 |
| Immigrants | Middle Africa | 0.8 /100 | #255 | Tragic $77,559 |
| Belizeans | 0.6 /100 | #256 | Tragic $77,028 |
| Immigrants | Senegal | 0.5 /100 | #257 | Tragic $76,915 |
| Immigrants | Nicaragua | 0.5 /100 | #258 | Tragic $76,784 |
| Spanish American Indians | 0.4 /100 | #259 | Tragic $76,670 |
| Jamaicans | 0.4 /100 | #260 | Tragic $76,583 |
| Immigrants | Grenada | 0.4 /100 | #261 | Tragic $76,517 |