Apache vs Immigrants from Israel Median Household Income
COMPARE
Apache
Immigrants from Israel
Median Household Income
Median Household Income Comparison
Apache
Immigrants from Israel
$70,927
MEDIAN HOUSEHOLD INCOME
0.0/ 100
METRIC RATING
316th/ 347
METRIC RANK
$104,090
MEDIAN HOUSEHOLD INCOME
100.0/ 100
METRIC RATING
15th/ 347
METRIC RANK
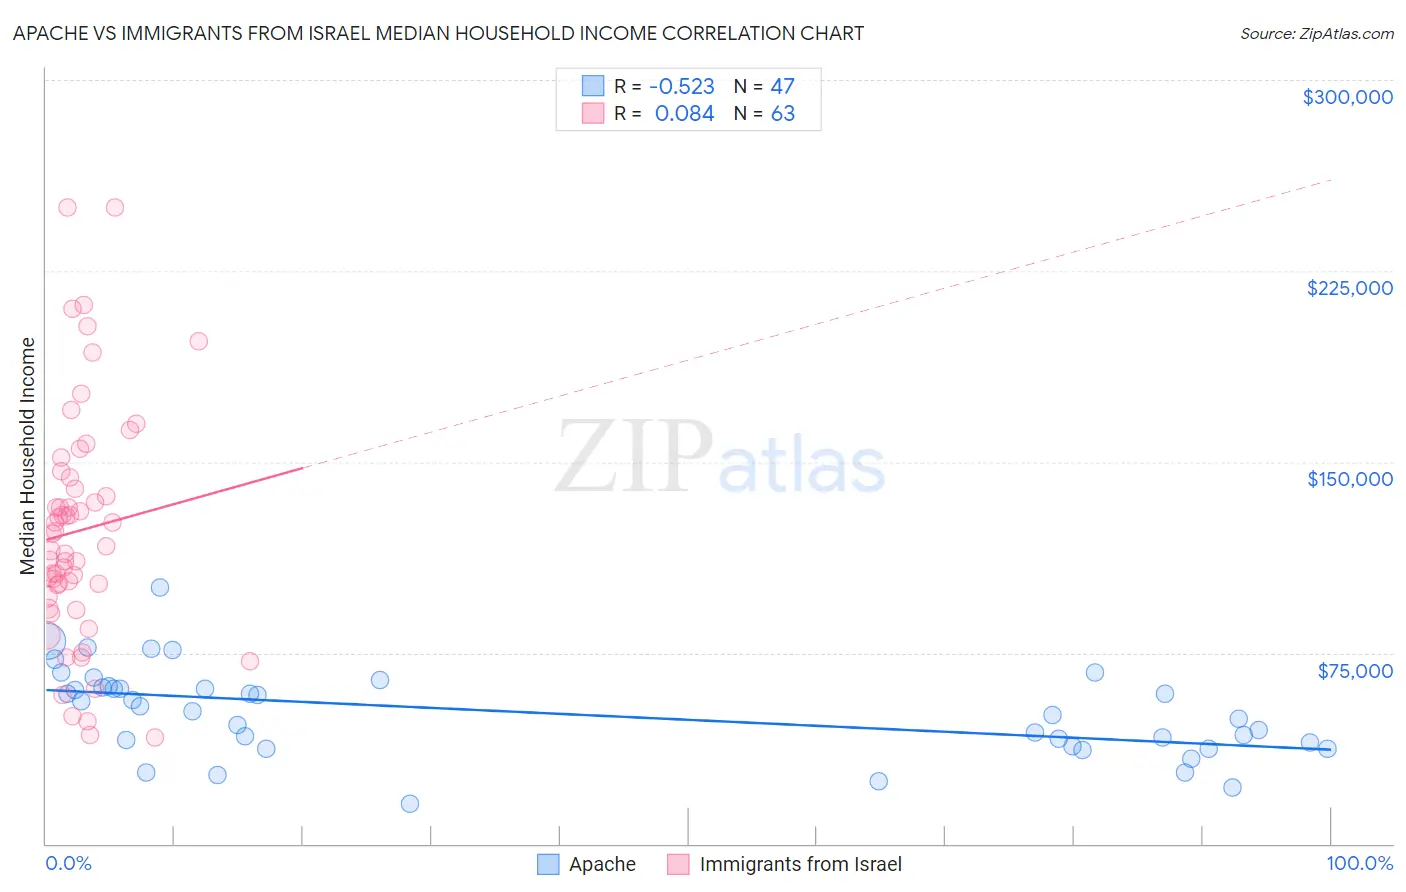
Apache vs Immigrants from Israel Median Household Income Correlation Chart
The statistical analysis conducted on geographies consisting of 230,997,736 people shows a substantial negative correlation between the proportion of Apache and median household income in the United States with a correlation coefficient (R) of -0.523 and weighted average of $70,927. Similarly, the statistical analysis conducted on geographies consisting of 209,966,745 people shows a slight positive correlation between the proportion of Immigrants from Israel and median household income in the United States with a correlation coefficient (R) of 0.084 and weighted average of $104,090, a difference of 46.8%.
Median Household Income Correlation Summary
| Measurement | Apache | Immigrants from Israel |
| Minimum | $15,577 | $41,875 |
| Maximum | $100,781 | $250,001 |
| Range | $85,204 | $208,126 |
| Mean | $51,361 | $123,014 |
| Median | $52,202 | $116,644 |
| Interquartile 25% (IQ1) | $38,125 | $97,035 |
| Interquartile 75% (IQ3) | $61,561 | $143,680 |
| Interquartile Range (IQR) | $23,436 | $46,645 |
| Standard Deviation (Sample) | $17,390 | $45,941 |
| Standard Deviation (Population) | $17,204 | $45,575 |
Similar Demographics by Median Household Income
Demographics Similar to Apache by Median Household Income
In terms of median household income, the demographic groups most similar to Apache are Ottawa ($70,984, a difference of 0.080%), Cajun ($70,605, a difference of 0.46%), Dominican ($71,302, a difference of 0.53%), Chippewa ($70,539, a difference of 0.55%), and Immigrants from Bahamas ($71,349, a difference of 0.59%).
| Demographics | Rating | Rank | Median Household Income |
| Immigrants | Caribbean | 0.0 /100 | #309 | Tragic $71,860 |
| U.S. Virgin Islanders | 0.0 /100 | #310 | Tragic $71,853 |
| Immigrants | Zaire | 0.0 /100 | #311 | Tragic $71,801 |
| Immigrants | Honduras | 0.0 /100 | #312 | Tragic $71,452 |
| Immigrants | Bahamas | 0.0 /100 | #313 | Tragic $71,349 |
| Dominicans | 0.0 /100 | #314 | Tragic $71,302 |
| Ottawa | 0.0 /100 | #315 | Tragic $70,984 |
| Apache | 0.0 /100 | #316 | Tragic $70,927 |
| Cajuns | 0.0 /100 | #317 | Tragic $70,605 |
| Chippewa | 0.0 /100 | #318 | Tragic $70,539 |
| Immigrants | Dominican Republic | 0.0 /100 | #319 | Tragic $70,208 |
| Colville | 0.0 /100 | #320 | Tragic $70,094 |
| Chickasaw | 0.0 /100 | #321 | Tragic $70,005 |
| Choctaw | 0.0 /100 | #322 | Tragic $69,947 |
| Bahamians | 0.0 /100 | #323 | Tragic $69,726 |
Demographics Similar to Immigrants from Israel by Median Household Income
In terms of median household income, the demographic groups most similar to Immigrants from Israel are Immigrants from Ireland ($104,692, a difference of 0.58%), Immigrants from Eastern Asia ($104,796, a difference of 0.68%), Burmese ($103,145, a difference of 0.92%), Immigrants from Korea ($102,962, a difference of 1.1%), and Indian (Asian) ($105,262, a difference of 1.1%).
| Demographics | Rating | Rank | Median Household Income |
| Immigrants | Iran | 100.0 /100 | #8 | Exceptional $108,055 |
| Okinawans | 100.0 /100 | #9 | Exceptional $106,624 |
| Immigrants | South Central Asia | 100.0 /100 | #10 | Exceptional $106,057 |
| Immigrants | China | 100.0 /100 | #11 | Exceptional $105,335 |
| Indians (Asian) | 100.0 /100 | #12 | Exceptional $105,262 |
| Immigrants | Eastern Asia | 100.0 /100 | #13 | Exceptional $104,796 |
| Immigrants | Ireland | 100.0 /100 | #14 | Exceptional $104,692 |
| Immigrants | Israel | 100.0 /100 | #15 | Exceptional $104,090 |
| Burmese | 100.0 /100 | #16 | Exceptional $103,145 |
| Immigrants | Korea | 100.0 /100 | #17 | Exceptional $102,962 |
| Cypriots | 100.0 /100 | #18 | Exceptional $102,843 |
| Immigrants | Australia | 100.0 /100 | #19 | Exceptional $102,562 |
| Bolivians | 100.0 /100 | #20 | Exceptional $102,195 |
| Eastern Europeans | 100.0 /100 | #21 | Exceptional $101,781 |
| Asians | 100.0 /100 | #22 | Exceptional $101,681 |