Spaniard vs Immigrants from Grenada Median Household Income
COMPARE
Spaniard
Immigrants from Grenada
Median Household Income
Median Household Income Comparison
Spaniards
Immigrants from Grenada
$84,644
MEDIAN HOUSEHOLD INCOME
42.7/ 100
METRIC RATING
183rd/ 347
METRIC RANK
$76,517
MEDIAN HOUSEHOLD INCOME
0.4/ 100
METRIC RATING
261st/ 347
METRIC RANK
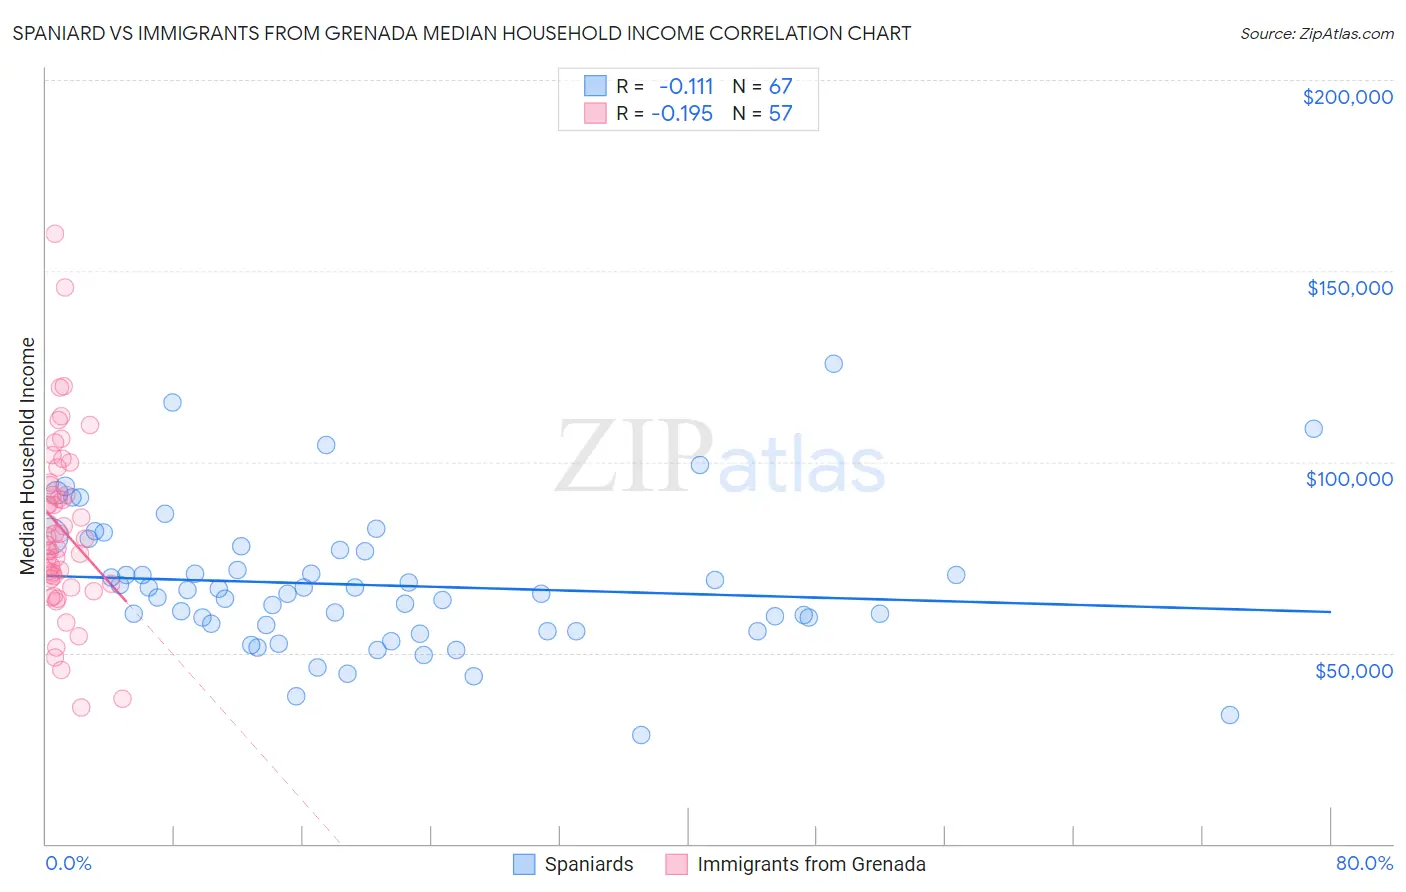
Spaniard vs Immigrants from Grenada Median Household Income Correlation Chart
The statistical analysis conducted on geographies consisting of 443,014,990 people shows a poor negative correlation between the proportion of Spaniards and median household income in the United States with a correlation coefficient (R) of -0.111 and weighted average of $84,644. Similarly, the statistical analysis conducted on geographies consisting of 67,183,202 people shows a poor negative correlation between the proportion of Immigrants from Grenada and median household income in the United States with a correlation coefficient (R) of -0.195 and weighted average of $76,517, a difference of 10.6%.
Median Household Income Correlation Summary
| Measurement | Spaniard | Immigrants from Grenada |
| Minimum | $28,571 | $35,840 |
| Maximum | $125,625 | $159,688 |
| Range | $97,054 | $123,848 |
| Mean | $67,731 | $82,524 |
| Median | $65,475 | $79,885 |
| Interquartile 25% (IQ1) | $55,726 | $68,699 |
| Interquartile 75% (IQ3) | $77,042 | $94,214 |
| Interquartile Range (IQR) | $21,316 | $25,515 |
| Standard Deviation (Sample) | $18,232 | $23,320 |
| Standard Deviation (Population) | $18,096 | $23,115 |
Similar Demographics by Median Household Income
Demographics Similar to Spaniards by Median Household Income
In terms of median household income, the demographic groups most similar to Spaniards are Uruguayan ($84,691, a difference of 0.060%), Hawaiian ($84,729, a difference of 0.10%), Immigrants from Portugal ($84,740, a difference of 0.11%), English ($84,915, a difference of 0.32%), and Czechoslovakian ($84,965, a difference of 0.38%).
| Demographics | Rating | Rank | Median Household Income |
| Alsatians | 49.2 /100 | #176 | Average $85,053 |
| Immigrants | Eritrea | 48.8 /100 | #177 | Average $85,025 |
| Czechoslovakians | 47.8 /100 | #178 | Average $84,965 |
| English | 47.0 /100 | #179 | Average $84,915 |
| Immigrants | Portugal | 44.2 /100 | #180 | Average $84,740 |
| Hawaiians | 44.1 /100 | #181 | Average $84,729 |
| Uruguayans | 43.5 /100 | #182 | Average $84,691 |
| Spaniards | 42.7 /100 | #183 | Average $84,644 |
| Immigrants | Eastern Africa | 37.4 /100 | #184 | Fair $84,299 |
| Kenyans | 34.2 /100 | #185 | Fair $84,085 |
| Puget Sound Salish | 33.2 /100 | #186 | Fair $84,011 |
| Belgians | 33.2 /100 | #187 | Fair $84,008 |
| Tlingit-Haida | 32.6 /100 | #188 | Fair $83,968 |
| Immigrants | Colombia | 31.7 /100 | #189 | Fair $83,902 |
| Slovaks | 30.2 /100 | #190 | Fair $83,798 |
Demographics Similar to Immigrants from Grenada by Median Household Income
In terms of median household income, the demographic groups most similar to Immigrants from Grenada are Jamaican ($76,583, a difference of 0.090%), French American Indian ($76,387, a difference of 0.17%), Alaskan Athabascan ($76,383, a difference of 0.18%), Spanish American Indian ($76,670, a difference of 0.20%), and Immigrants from Nicaragua ($76,784, a difference of 0.35%).
| Demographics | Rating | Rank | Median Household Income |
| Sub-Saharan Africans | 0.8 /100 | #254 | Tragic $77,631 |
| Immigrants | Middle Africa | 0.8 /100 | #255 | Tragic $77,559 |
| Belizeans | 0.6 /100 | #256 | Tragic $77,028 |
| Immigrants | Senegal | 0.5 /100 | #257 | Tragic $76,915 |
| Immigrants | Nicaragua | 0.5 /100 | #258 | Tragic $76,784 |
| Spanish American Indians | 0.4 /100 | #259 | Tragic $76,670 |
| Jamaicans | 0.4 /100 | #260 | Tragic $76,583 |
| Immigrants | Grenada | 0.4 /100 | #261 | Tragic $76,517 |
| French American Indians | 0.4 /100 | #262 | Tragic $76,387 |
| Alaskan Athabascans | 0.4 /100 | #263 | Tragic $76,383 |
| Guatemalans | 0.3 /100 | #264 | Tragic $75,961 |
| Immigrants | Belize | 0.3 /100 | #265 | Tragic $75,938 |
| Americans | 0.3 /100 | #266 | Tragic $75,932 |
| German Russians | 0.3 /100 | #267 | Tragic $75,856 |
| Immigrants | Jamaica | 0.3 /100 | #268 | Tragic $75,851 |