Apache vs U.S. Virgin Islander Median Household Income
COMPARE
Apache
U.S. Virgin Islander
Median Household Income
Median Household Income Comparison
Apache
U.S. Virgin Islanders
$70,927
MEDIAN HOUSEHOLD INCOME
0.0/ 100
METRIC RATING
316th/ 347
METRIC RANK
$71,853
MEDIAN HOUSEHOLD INCOME
0.0/ 100
METRIC RATING
310th/ 347
METRIC RANK
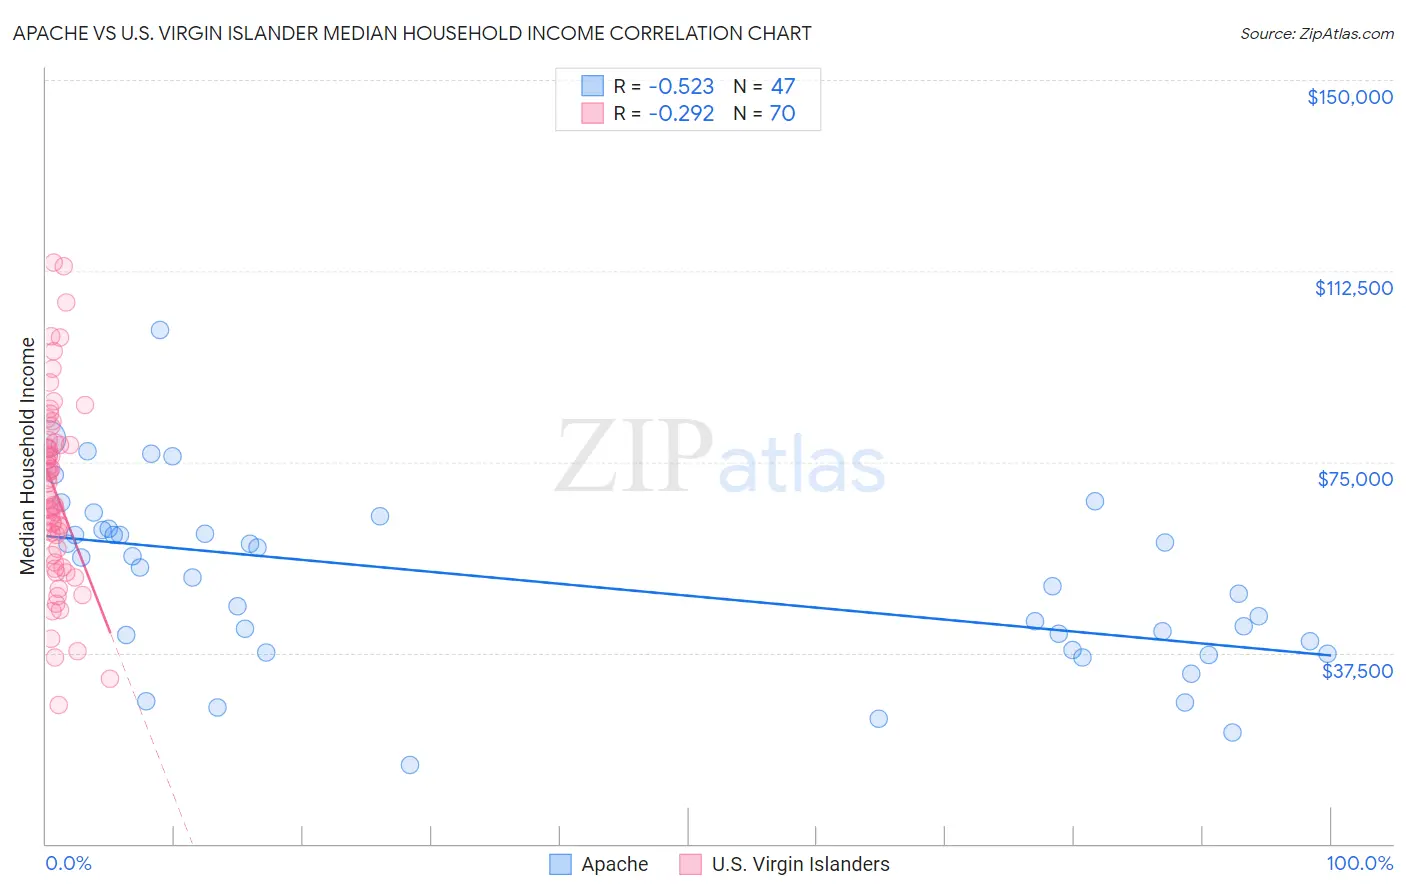
Apache vs U.S. Virgin Islander Median Household Income Correlation Chart
The statistical analysis conducted on geographies consisting of 230,997,736 people shows a substantial negative correlation between the proportion of Apache and median household income in the United States with a correlation coefficient (R) of -0.523 and weighted average of $70,927. Similarly, the statistical analysis conducted on geographies consisting of 87,500,449 people shows a weak negative correlation between the proportion of U.S. Virgin Islanders and median household income in the United States with a correlation coefficient (R) of -0.292 and weighted average of $71,853, a difference of 1.3%.
Median Household Income Correlation Summary
| Measurement | Apache | U.S. Virgin Islander |
| Minimum | $15,577 | $27,212 |
| Maximum | $100,781 | $114,181 |
| Range | $85,204 | $86,969 |
| Mean | $51,361 | $69,001 |
| Median | $52,202 | $68,056 |
| Interquartile 25% (IQ1) | $38,125 | $56,650 |
| Interquartile 75% (IQ3) | $61,561 | $78,391 |
| Interquartile Range (IQR) | $23,436 | $21,741 |
| Standard Deviation (Sample) | $17,390 | $18,092 |
| Standard Deviation (Population) | $17,204 | $17,962 |
Demographics Similar to Apache and U.S. Virgin Islanders by Median Household Income
In terms of median household income, the demographic groups most similar to Apache are Ottawa ($70,984, a difference of 0.080%), Cajun ($70,605, a difference of 0.46%), Dominican ($71,302, a difference of 0.53%), Chippewa ($70,539, a difference of 0.55%), and Immigrants from Bahamas ($71,349, a difference of 0.59%). Similarly, the demographic groups most similar to U.S. Virgin Islanders are Immigrants from Caribbean ($71,860, a difference of 0.010%), Immigrants from Zaire ($71,801, a difference of 0.070%), Yakama ($72,225, a difference of 0.52%), Immigrants from Honduras ($71,452, a difference of 0.56%), and Immigrants from Bahamas ($71,349, a difference of 0.71%).
| Demographics | Rating | Rank | Median Household Income |
| Africans | 0.0 /100 | #303 | Tragic $72,650 |
| Immigrants | Haiti | 0.0 /100 | #304 | Tragic $72,599 |
| Hondurans | 0.0 /100 | #305 | Tragic $72,588 |
| Potawatomi | 0.0 /100 | #306 | Tragic $72,576 |
| Ute | 0.0 /100 | #307 | Tragic $72,402 |
| Yakama | 0.0 /100 | #308 | Tragic $72,225 |
| Immigrants | Caribbean | 0.0 /100 | #309 | Tragic $71,860 |
| U.S. Virgin Islanders | 0.0 /100 | #310 | Tragic $71,853 |
| Immigrants | Zaire | 0.0 /100 | #311 | Tragic $71,801 |
| Immigrants | Honduras | 0.0 /100 | #312 | Tragic $71,452 |
| Immigrants | Bahamas | 0.0 /100 | #313 | Tragic $71,349 |
| Dominicans | 0.0 /100 | #314 | Tragic $71,302 |
| Ottawa | 0.0 /100 | #315 | Tragic $70,984 |
| Apache | 0.0 /100 | #316 | Tragic $70,927 |
| Cajuns | 0.0 /100 | #317 | Tragic $70,605 |
| Chippewa | 0.0 /100 | #318 | Tragic $70,539 |
| Immigrants | Dominican Republic | 0.0 /100 | #319 | Tragic $70,208 |
| Colville | 0.0 /100 | #320 | Tragic $70,094 |
| Chickasaw | 0.0 /100 | #321 | Tragic $70,005 |
| Choctaw | 0.0 /100 | #322 | Tragic $69,947 |
| Bahamians | 0.0 /100 | #323 | Tragic $69,726 |