Apache vs Barbadian Median Household Income
COMPARE
Apache
Barbadian
Median Household Income
Median Household Income Comparison
Apache
Barbadians
$70,927
MEDIAN HOUSEHOLD INCOME
0.0/ 100
METRIC RATING
316th/ 347
METRIC RANK
$79,664
MEDIAN HOUSEHOLD INCOME
3.0/ 100
METRIC RATING
238th/ 347
METRIC RANK
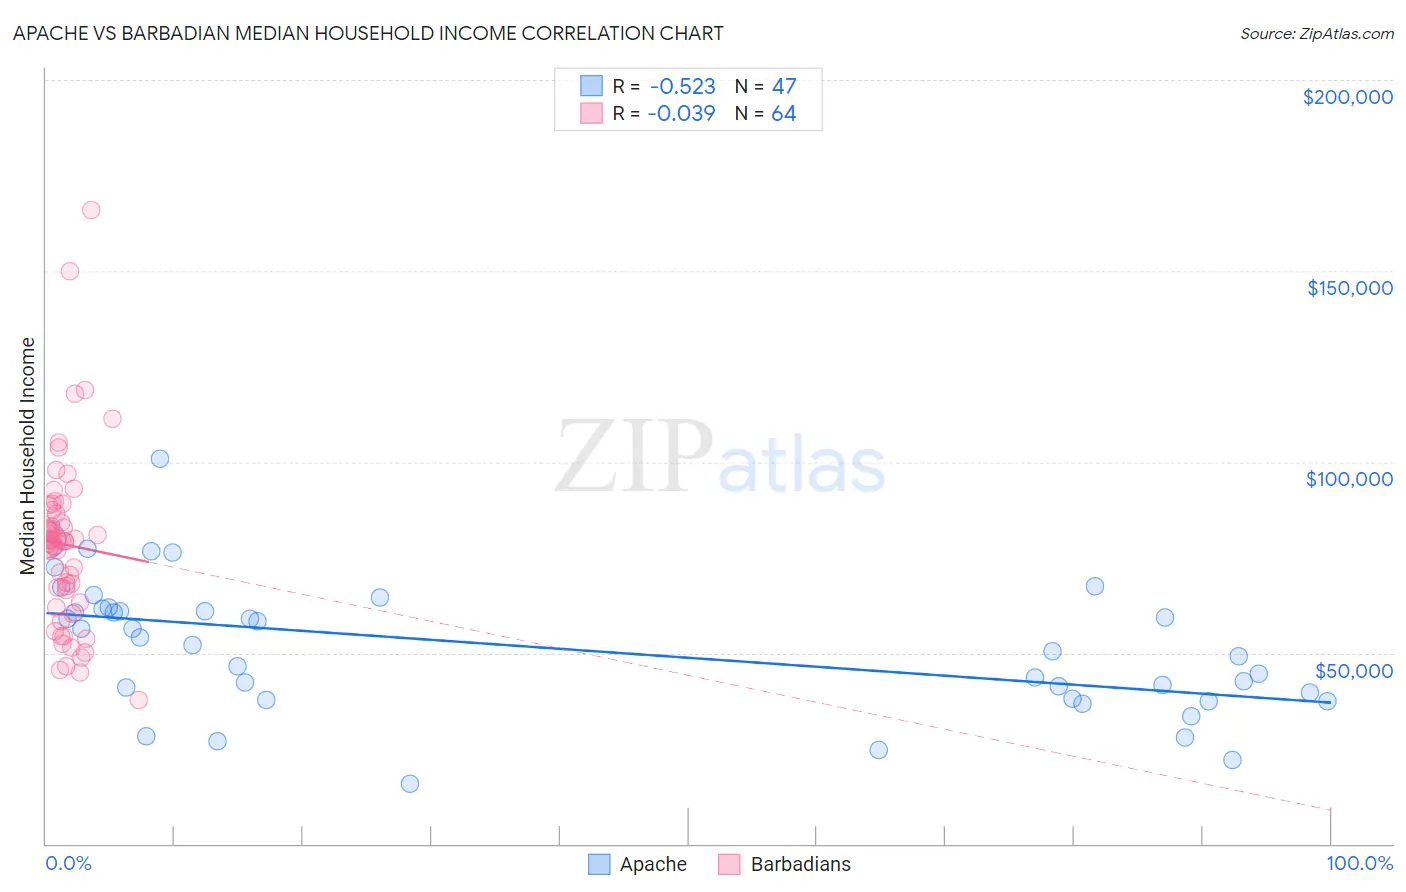
Apache vs Barbadian Median Household Income Correlation Chart
The statistical analysis conducted on geographies consisting of 230,997,736 people shows a substantial negative correlation between the proportion of Apache and median household income in the United States with a correlation coefficient (R) of -0.523 and weighted average of $70,927. Similarly, the statistical analysis conducted on geographies consisting of 141,253,267 people shows no correlation between the proportion of Barbadians and median household income in the United States with a correlation coefficient (R) of -0.039 and weighted average of $79,664, a difference of 12.3%.
Median Household Income Correlation Summary
| Measurement | Apache | Barbadian |
| Minimum | $15,577 | $37,500 |
| Maximum | $100,781 | $166,111 |
| Range | $85,204 | $128,611 |
| Mean | $51,361 | $78,382 |
| Median | $52,202 | $79,225 |
| Interquartile 25% (IQ1) | $38,125 | $64,694 |
| Interquartile 75% (IQ3) | $61,561 | $86,916 |
| Interquartile Range (IQR) | $23,436 | $22,222 |
| Standard Deviation (Sample) | $17,390 | $22,744 |
| Standard Deviation (Population) | $17,204 | $22,565 |
Similar Demographics by Median Household Income
Demographics Similar to Apache by Median Household Income
In terms of median household income, the demographic groups most similar to Apache are Ottawa ($70,984, a difference of 0.080%), Cajun ($70,605, a difference of 0.46%), Dominican ($71,302, a difference of 0.53%), Chippewa ($70,539, a difference of 0.55%), and Immigrants from Bahamas ($71,349, a difference of 0.59%).
| Demographics | Rating | Rank | Median Household Income |
| Immigrants | Caribbean | 0.0 /100 | #309 | Tragic $71,860 |
| U.S. Virgin Islanders | 0.0 /100 | #310 | Tragic $71,853 |
| Immigrants | Zaire | 0.0 /100 | #311 | Tragic $71,801 |
| Immigrants | Honduras | 0.0 /100 | #312 | Tragic $71,452 |
| Immigrants | Bahamas | 0.0 /100 | #313 | Tragic $71,349 |
| Dominicans | 0.0 /100 | #314 | Tragic $71,302 |
| Ottawa | 0.0 /100 | #315 | Tragic $70,984 |
| Apache | 0.0 /100 | #316 | Tragic $70,927 |
| Cajuns | 0.0 /100 | #317 | Tragic $70,605 |
| Chippewa | 0.0 /100 | #318 | Tragic $70,539 |
| Immigrants | Dominican Republic | 0.0 /100 | #319 | Tragic $70,208 |
| Colville | 0.0 /100 | #320 | Tragic $70,094 |
| Chickasaw | 0.0 /100 | #321 | Tragic $70,005 |
| Choctaw | 0.0 /100 | #322 | Tragic $69,947 |
| Bahamians | 0.0 /100 | #323 | Tragic $69,726 |
Demographics Similar to Barbadians by Median Household Income
In terms of median household income, the demographic groups most similar to Barbadians are Nicaraguan ($79,737, a difference of 0.090%), Alaska Native ($79,509, a difference of 0.20%), Immigrants from Western Africa ($79,490, a difference of 0.22%), Immigrants from Bosnia and Herzegovina ($79,888, a difference of 0.28%), and Nonimmigrants ($79,429, a difference of 0.30%).
| Demographics | Rating | Rank | Median Household Income |
| Trinidadians and Tobagonians | 4.7 /100 | #231 | Tragic $80,402 |
| Immigrants | Trinidad and Tobago | 4.6 /100 | #232 | Tragic $80,373 |
| Immigrants | Azores | 4.5 /100 | #233 | Tragic $80,357 |
| Immigrants | Ecuador | 4.5 /100 | #234 | Tragic $80,341 |
| Immigrants | Guyana | 4.5 /100 | #235 | Tragic $80,324 |
| Immigrants | Bosnia and Herzegovina | 3.4 /100 | #236 | Tragic $79,888 |
| Nicaraguans | 3.1 /100 | #237 | Tragic $79,737 |
| Barbadians | 3.0 /100 | #238 | Tragic $79,664 |
| Alaska Natives | 2.7 /100 | #239 | Tragic $79,509 |
| Immigrants | Western Africa | 2.7 /100 | #240 | Tragic $79,490 |
| Immigrants | Nonimmigrants | 2.6 /100 | #241 | Tragic $79,429 |
| Immigrants | Sudan | 2.1 /100 | #242 | Tragic $79,103 |
| Immigrants | Barbados | 1.9 /100 | #243 | Tragic $78,989 |
| Marshallese | 1.9 /100 | #244 | Tragic $78,930 |
| Inupiat | 1.8 /100 | #245 | Tragic $78,841 |