Apache vs Kenyan Median Household Income
COMPARE
Apache
Kenyan
Median Household Income
Median Household Income Comparison
Apache
Kenyans
$70,927
MEDIAN HOUSEHOLD INCOME
0.0/ 100
METRIC RATING
316th/ 347
METRIC RANK
$84,085
MEDIAN HOUSEHOLD INCOME
34.2/ 100
METRIC RATING
185th/ 347
METRIC RANK
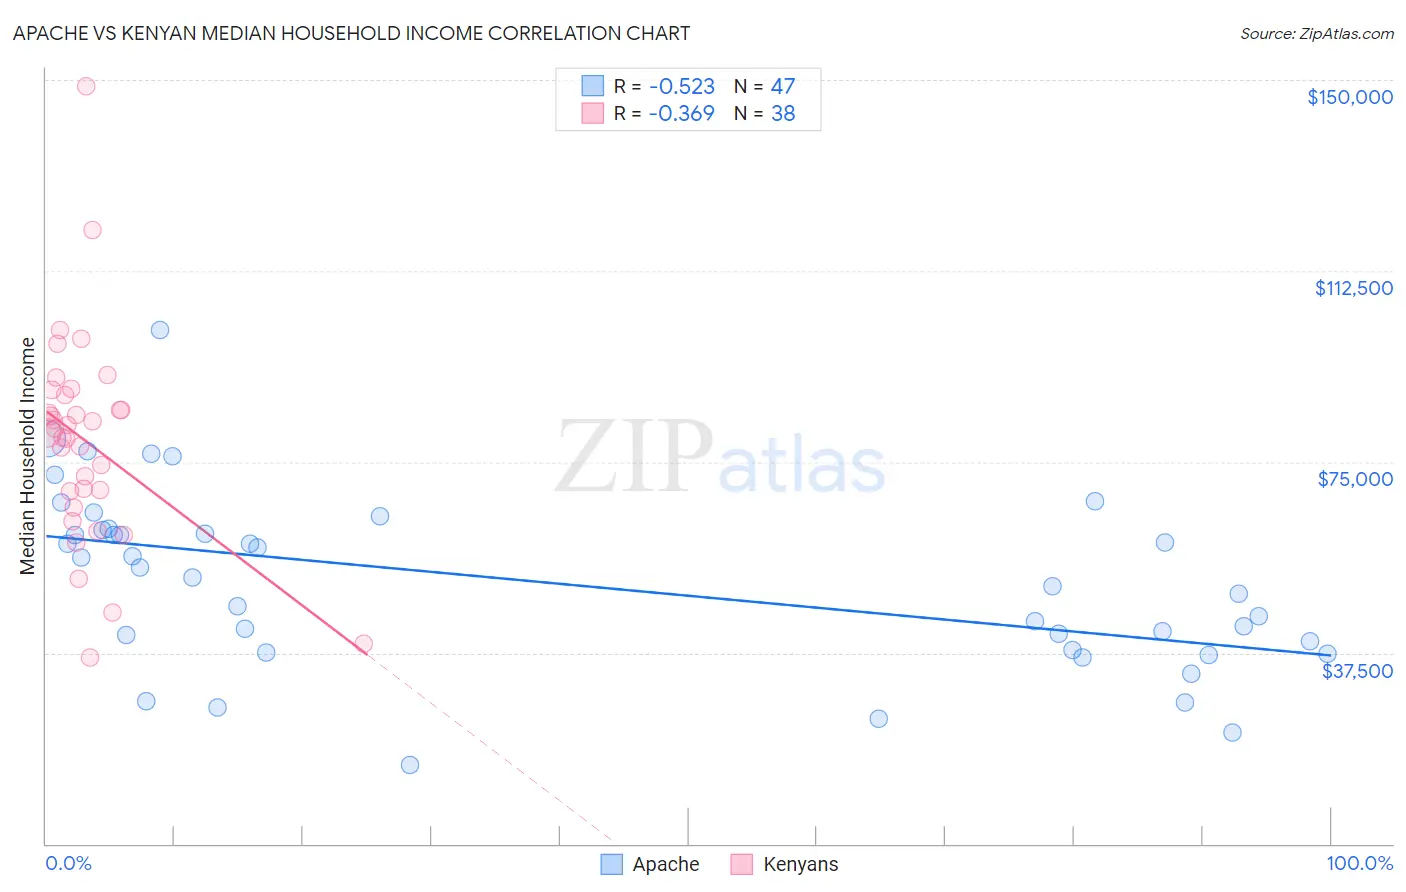
Apache vs Kenyan Median Household Income Correlation Chart
The statistical analysis conducted on geographies consisting of 230,997,736 people shows a substantial negative correlation between the proportion of Apache and median household income in the United States with a correlation coefficient (R) of -0.523 and weighted average of $70,927. Similarly, the statistical analysis conducted on geographies consisting of 168,121,299 people shows a mild negative correlation between the proportion of Kenyans and median household income in the United States with a correlation coefficient (R) of -0.369 and weighted average of $84,085, a difference of 18.5%.
Median Household Income Correlation Summary
| Measurement | Apache | Kenyan |
| Minimum | $15,577 | $36,467 |
| Maximum | $100,781 | $148,810 |
| Range | $85,204 | $112,343 |
| Mean | $51,361 | $79,073 |
| Median | $52,202 | $81,160 |
| Interquartile 25% (IQ1) | $38,125 | $69,173 |
| Interquartile 75% (IQ3) | $61,561 | $88,022 |
| Interquartile Range (IQR) | $23,436 | $18,850 |
| Standard Deviation (Sample) | $17,390 | $20,616 |
| Standard Deviation (Population) | $17,204 | $20,343 |
Similar Demographics by Median Household Income
Demographics Similar to Apache by Median Household Income
In terms of median household income, the demographic groups most similar to Apache are Ottawa ($70,984, a difference of 0.080%), Cajun ($70,605, a difference of 0.46%), Dominican ($71,302, a difference of 0.53%), Chippewa ($70,539, a difference of 0.55%), and Immigrants from Bahamas ($71,349, a difference of 0.59%).
| Demographics | Rating | Rank | Median Household Income |
| Immigrants | Caribbean | 0.0 /100 | #309 | Tragic $71,860 |
| U.S. Virgin Islanders | 0.0 /100 | #310 | Tragic $71,853 |
| Immigrants | Zaire | 0.0 /100 | #311 | Tragic $71,801 |
| Immigrants | Honduras | 0.0 /100 | #312 | Tragic $71,452 |
| Immigrants | Bahamas | 0.0 /100 | #313 | Tragic $71,349 |
| Dominicans | 0.0 /100 | #314 | Tragic $71,302 |
| Ottawa | 0.0 /100 | #315 | Tragic $70,984 |
| Apache | 0.0 /100 | #316 | Tragic $70,927 |
| Cajuns | 0.0 /100 | #317 | Tragic $70,605 |
| Chippewa | 0.0 /100 | #318 | Tragic $70,539 |
| Immigrants | Dominican Republic | 0.0 /100 | #319 | Tragic $70,208 |
| Colville | 0.0 /100 | #320 | Tragic $70,094 |
| Chickasaw | 0.0 /100 | #321 | Tragic $70,005 |
| Choctaw | 0.0 /100 | #322 | Tragic $69,947 |
| Bahamians | 0.0 /100 | #323 | Tragic $69,726 |
Demographics Similar to Kenyans by Median Household Income
In terms of median household income, the demographic groups most similar to Kenyans are Puget Sound Salish ($84,011, a difference of 0.090%), Belgian ($84,008, a difference of 0.090%), Tlingit-Haida ($83,968, a difference of 0.14%), Immigrants from Colombia ($83,902, a difference of 0.22%), and Immigrants from Eastern Africa ($84,299, a difference of 0.25%).
| Demographics | Rating | Rank | Median Household Income |
| Czechoslovakians | 47.8 /100 | #178 | Average $84,965 |
| English | 47.0 /100 | #179 | Average $84,915 |
| Immigrants | Portugal | 44.2 /100 | #180 | Average $84,740 |
| Hawaiians | 44.1 /100 | #181 | Average $84,729 |
| Uruguayans | 43.5 /100 | #182 | Average $84,691 |
| Spaniards | 42.7 /100 | #183 | Average $84,644 |
| Immigrants | Eastern Africa | 37.4 /100 | #184 | Fair $84,299 |
| Kenyans | 34.2 /100 | #185 | Fair $84,085 |
| Puget Sound Salish | 33.2 /100 | #186 | Fair $84,011 |
| Belgians | 33.2 /100 | #187 | Fair $84,008 |
| Tlingit-Haida | 32.6 /100 | #188 | Fair $83,968 |
| Immigrants | Colombia | 31.7 /100 | #189 | Fair $83,902 |
| Slovaks | 30.2 /100 | #190 | Fair $83,798 |
| Iraqis | 29.6 /100 | #191 | Fair $83,753 |
| Welsh | 28.0 /100 | #192 | Fair $83,628 |