Apache vs Osage Median Household Income
COMPARE
Apache
Osage
Median Household Income
Median Household Income Comparison
Apache
Osage
$70,927
MEDIAN HOUSEHOLD INCOME
0.0/ 100
METRIC RATING
316th/ 347
METRIC RANK
$75,240
MEDIAN HOUSEHOLD INCOME
0.2/ 100
METRIC RATING
278th/ 347
METRIC RANK
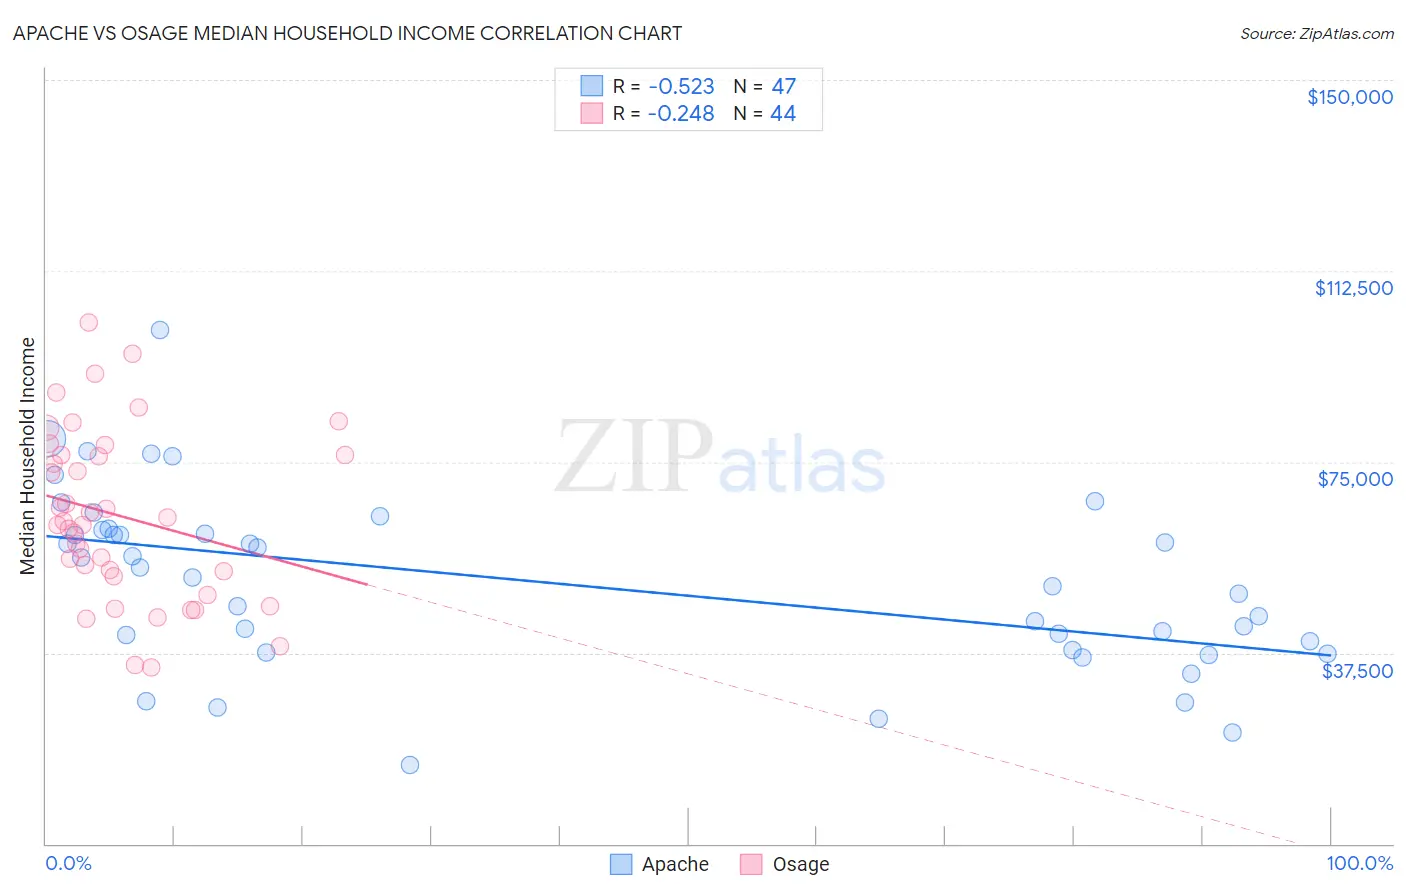
Apache vs Osage Median Household Income Correlation Chart
The statistical analysis conducted on geographies consisting of 230,997,736 people shows a substantial negative correlation between the proportion of Apache and median household income in the United States with a correlation coefficient (R) of -0.523 and weighted average of $70,927. Similarly, the statistical analysis conducted on geographies consisting of 91,796,475 people shows a weak negative correlation between the proportion of Osage and median household income in the United States with a correlation coefficient (R) of -0.248 and weighted average of $75,240, a difference of 6.1%.
Median Household Income Correlation Summary
| Measurement | Apache | Osage |
| Minimum | $15,577 | $34,735 |
| Maximum | $100,781 | $102,379 |
| Range | $85,204 | $67,644 |
| Mean | $51,361 | $64,368 |
| Median | $52,202 | $62,912 |
| Interquartile 25% (IQ1) | $38,125 | $52,984 |
| Interquartile 75% (IQ3) | $61,561 | $76,272 |
| Interquartile Range (IQR) | $23,436 | $23,288 |
| Standard Deviation (Sample) | $17,390 | $16,574 |
| Standard Deviation (Population) | $17,204 | $16,385 |
Similar Demographics by Median Household Income
Demographics Similar to Apache by Median Household Income
In terms of median household income, the demographic groups most similar to Apache are Ottawa ($70,984, a difference of 0.080%), Cajun ($70,605, a difference of 0.46%), Dominican ($71,302, a difference of 0.53%), Chippewa ($70,539, a difference of 0.55%), and Immigrants from Bahamas ($71,349, a difference of 0.59%).
| Demographics | Rating | Rank | Median Household Income |
| Immigrants | Caribbean | 0.0 /100 | #309 | Tragic $71,860 |
| U.S. Virgin Islanders | 0.0 /100 | #310 | Tragic $71,853 |
| Immigrants | Zaire | 0.0 /100 | #311 | Tragic $71,801 |
| Immigrants | Honduras | 0.0 /100 | #312 | Tragic $71,452 |
| Immigrants | Bahamas | 0.0 /100 | #313 | Tragic $71,349 |
| Dominicans | 0.0 /100 | #314 | Tragic $71,302 |
| Ottawa | 0.0 /100 | #315 | Tragic $70,984 |
| Apache | 0.0 /100 | #316 | Tragic $70,927 |
| Cajuns | 0.0 /100 | #317 | Tragic $70,605 |
| Chippewa | 0.0 /100 | #318 | Tragic $70,539 |
| Immigrants | Dominican Republic | 0.0 /100 | #319 | Tragic $70,208 |
| Colville | 0.0 /100 | #320 | Tragic $70,094 |
| Chickasaw | 0.0 /100 | #321 | Tragic $70,005 |
| Choctaw | 0.0 /100 | #322 | Tragic $69,947 |
| Bahamians | 0.0 /100 | #323 | Tragic $69,726 |
Demographics Similar to Osage by Median Household Income
In terms of median household income, the demographic groups most similar to Osage are Immigrants from Guatemala ($75,123, a difference of 0.16%), Spanish American ($75,386, a difference of 0.19%), Immigrants from Latin America ($75,420, a difference of 0.24%), Senegalese ($74,999, a difference of 0.32%), and Immigrants from Micronesia ($75,574, a difference of 0.44%).
| Demographics | Rating | Rank | Median Household Income |
| Pennsylvania Germans | 0.3 /100 | #271 | Tragic $75,814 |
| Somalis | 0.3 /100 | #272 | Tragic $75,782 |
| Liberians | 0.2 /100 | #273 | Tragic $75,667 |
| British West Indians | 0.2 /100 | #274 | Tragic $75,647 |
| Immigrants | Micronesia | 0.2 /100 | #275 | Tragic $75,574 |
| Immigrants | Latin America | 0.2 /100 | #276 | Tragic $75,420 |
| Spanish Americans | 0.2 /100 | #277 | Tragic $75,386 |
| Osage | 0.2 /100 | #278 | Tragic $75,240 |
| Immigrants | Guatemala | 0.2 /100 | #279 | Tragic $75,123 |
| Senegalese | 0.2 /100 | #280 | Tragic $74,999 |
| Immigrants | Liberia | 0.1 /100 | #281 | Tragic $74,896 |
| Central American Indians | 0.1 /100 | #282 | Tragic $74,847 |
| Cree | 0.1 /100 | #283 | Tragic $74,685 |
| Yaqui | 0.1 /100 | #284 | Tragic $74,596 |
| Mexicans | 0.1 /100 | #285 | Tragic $74,399 |