Apache vs Immigrants from Grenada Nursery School
COMPARE
Apache
Immigrants from Grenada
Nursery School
Nursery School Comparison
Apache
Immigrants from Grenada
98.1%
NURSERY SCHOOL
73.2/ 100
METRIC RATING
149th/ 347
METRIC RANK
97.3%
NURSERY SCHOOL
0.0/ 100
METRIC RATING
294th/ 347
METRIC RANK
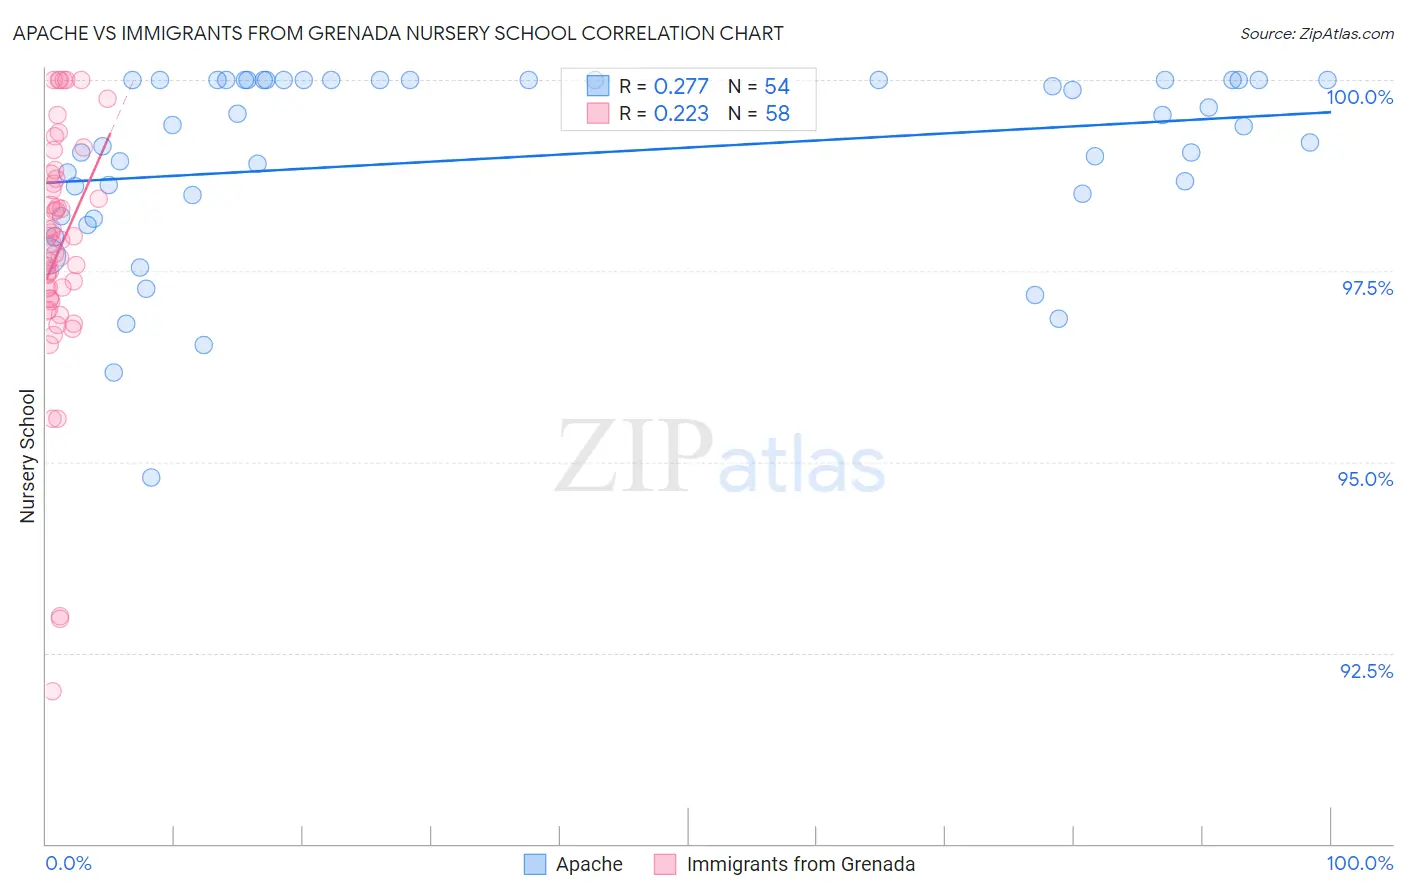
Apache vs Immigrants from Grenada Nursery School Correlation Chart
The statistical analysis conducted on geographies consisting of 231,142,814 people shows a weak positive correlation between the proportion of Apache and percentage of population with at least nursery school education in the United States with a correlation coefficient (R) of 0.277 and weighted average of 98.1%. Similarly, the statistical analysis conducted on geographies consisting of 67,200,336 people shows a weak positive correlation between the proportion of Immigrants from Grenada and percentage of population with at least nursery school education in the United States with a correlation coefficient (R) of 0.223 and weighted average of 97.3%, a difference of 0.82%.
Nursery School Correlation Summary
| Measurement | Apache | Immigrants from Grenada |
| Minimum | 94.8% | 92.0% |
| Maximum | 100.0% | 100.0% |
| Range | 5.2% | 8.0% |
| Mean | 99.0% | 97.8% |
| Median | 99.4% | 97.9% |
| Interquartile 25% (IQ1) | 98.5% | 97.1% |
| Interquartile 75% (IQ3) | 100.0% | 98.7% |
| Interquartile Range (IQR) | 1.5% | 1.6% |
| Standard Deviation (Sample) | 1.2% | 1.6% |
| Standard Deviation (Population) | 1.2% | 1.6% |
Similar Demographics by Nursery School
Demographics Similar to Apache by Nursery School
In terms of nursery school, the demographic groups most similar to Apache are Jordanian (98.1%, a difference of 0.0%), Hmong (98.1%, a difference of 0.010%), Immigrants from Greece (98.1%, a difference of 0.010%), Soviet Union (98.0%, a difference of 0.010%), and Dutch West Indian (98.0%, a difference of 0.010%).
| Demographics | Rating | Rank | Nursery School |
| Burmese | 81.7 /100 | #142 | Excellent 98.1% |
| Marshallese | 81.2 /100 | #143 | Excellent 98.1% |
| Alsatians | 80.3 /100 | #144 | Excellent 98.1% |
| Immigrants | Israel | 78.5 /100 | #145 | Good 98.1% |
| Filipinos | 78.5 /100 | #146 | Good 98.1% |
| Hmong | 75.7 /100 | #147 | Good 98.1% |
| Immigrants | Greece | 75.4 /100 | #148 | Good 98.1% |
| Apache | 73.2 /100 | #149 | Good 98.1% |
| Jordanians | 72.9 /100 | #150 | Good 98.1% |
| Soviet Union | 71.6 /100 | #151 | Good 98.0% |
| Dutch West Indians | 70.2 /100 | #152 | Good 98.0% |
| Immigrants | Moldova | 69.6 /100 | #153 | Good 98.0% |
| Immigrants | Iran | 68.7 /100 | #154 | Good 98.0% |
| Immigrants | South Central Asia | 66.7 /100 | #155 | Good 98.0% |
| Venezuelans | 66.6 /100 | #156 | Good 98.0% |
Demographics Similar to Immigrants from Grenada by Nursery School
In terms of nursery school, the demographic groups most similar to Immigrants from Grenada are Malaysian (97.3%, a difference of 0.010%), Immigrants (97.2%, a difference of 0.010%), Houma (97.3%, a difference of 0.020%), Immigrants from Eritrea (97.2%, a difference of 0.020%), and British West Indian (97.3%, a difference of 0.040%).
| Demographics | Rating | Rank | Nursery School |
| Immigrants | Hong Kong | 0.0 /100 | #287 | Tragic 97.4% |
| Immigrants | Thailand | 0.0 /100 | #288 | Tragic 97.3% |
| Immigrants | St. Vincent and the Grenadines | 0.0 /100 | #289 | Tragic 97.3% |
| Immigrants | Afghanistan | 0.0 /100 | #290 | Tragic 97.3% |
| British West Indians | 0.0 /100 | #291 | Tragic 97.3% |
| Houma | 0.0 /100 | #292 | Tragic 97.3% |
| Malaysians | 0.0 /100 | #293 | Tragic 97.3% |
| Immigrants | Grenada | 0.0 /100 | #294 | Tragic 97.3% |
| Immigrants | Immigrants | 0.0 /100 | #295 | Tragic 97.2% |
| Immigrants | Eritrea | 0.0 /100 | #296 | Tragic 97.2% |
| Immigrants | Cuba | 0.0 /100 | #297 | Tragic 97.2% |
| Central American Indians | 0.0 /100 | #298 | Tragic 97.2% |
| Immigrants | Dominica | 0.0 /100 | #299 | Tragic 97.2% |
| Haitians | 0.0 /100 | #300 | Tragic 97.2% |
| Immigrants | South Eastern Asia | 0.0 /100 | #301 | Tragic 97.1% |