Apache vs Immigrants from Grenada Householder Income Ages 45 - 64 years
COMPARE
Apache
Immigrants from Grenada
Householder Income Ages 45 - 64 years
Householder Income Ages 45 - 64 years Comparison
Apache
Immigrants from Grenada
$82,184
HOUSEHOLDER INCOME AGES 45 - 64 YEARS
0.0/ 100
METRIC RATING
320th/ 347
METRIC RANK
$85,552
HOUSEHOLDER INCOME AGES 45 - 64 YEARS
0.1/ 100
METRIC RATING
295th/ 347
METRIC RANK
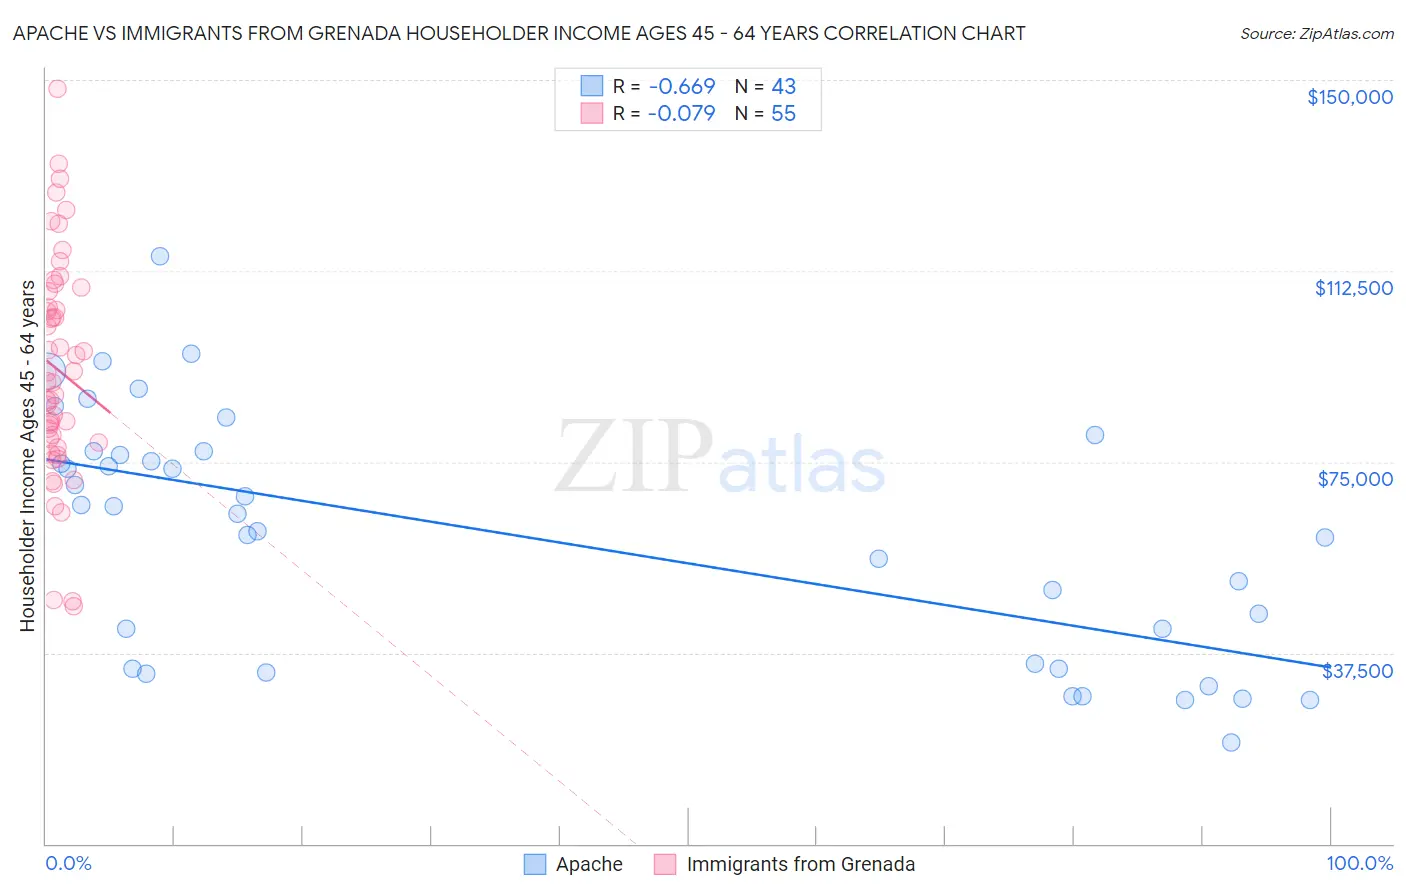
Apache vs Immigrants from Grenada Householder Income Ages 45 - 64 years Correlation Chart
The statistical analysis conducted on geographies consisting of 230,746,916 people shows a significant negative correlation between the proportion of Apache and household income with householder between the ages 45 and 64 in the United States with a correlation coefficient (R) of -0.669 and weighted average of $82,184. Similarly, the statistical analysis conducted on geographies consisting of 67,175,109 people shows a slight negative correlation between the proportion of Immigrants from Grenada and household income with householder between the ages 45 and 64 in the United States with a correlation coefficient (R) of -0.079 and weighted average of $85,552, a difference of 4.1%.
Householder Income Ages 45 - 64 years Correlation Summary
| Measurement | Apache | Immigrants from Grenada |
| Minimum | $19,917 | $46,607 |
| Maximum | $115,357 | $148,164 |
| Range | $95,440 | $101,557 |
| Mean | $60,429 | $93,124 |
| Median | $64,821 | $90,758 |
| Interquartile 25% (IQ1) | $34,492 | $78,920 |
| Interquartile 75% (IQ3) | $77,043 | $108,561 |
| Interquartile Range (IQR) | $42,551 | $29,641 |
| Standard Deviation (Sample) | $23,821 | $21,622 |
| Standard Deviation (Population) | $23,542 | $21,425 |
Similar Demographics by Householder Income Ages 45 - 64 years
Demographics Similar to Apache by Householder Income Ages 45 - 64 years
In terms of householder income ages 45 - 64 years, the demographic groups most similar to Apache are Chickasaw ($82,193, a difference of 0.010%), Yuman ($82,139, a difference of 0.050%), Choctaw ($82,287, a difference of 0.13%), Colville ($82,474, a difference of 0.35%), and Immigrants from Caribbean ($82,513, a difference of 0.40%).
| Demographics | Rating | Rank | Householder Income Ages 45 - 64 years |
| U.S. Virgin Islanders | 0.0 /100 | #313 | Tragic $82,736 |
| Immigrants | Honduras | 0.0 /100 | #314 | Tragic $82,697 |
| Paiute | 0.0 /100 | #315 | Tragic $82,629 |
| Immigrants | Caribbean | 0.0 /100 | #316 | Tragic $82,513 |
| Colville | 0.0 /100 | #317 | Tragic $82,474 |
| Choctaw | 0.0 /100 | #318 | Tragic $82,287 |
| Chickasaw | 0.0 /100 | #319 | Tragic $82,193 |
| Apache | 0.0 /100 | #320 | Tragic $82,184 |
| Yuman | 0.0 /100 | #321 | Tragic $82,139 |
| Sioux | 0.0 /100 | #322 | Tragic $81,750 |
| Bahamians | 0.0 /100 | #323 | Tragic $81,369 |
| Yup'ik | 0.0 /100 | #324 | Tragic $81,000 |
| Immigrants | Cuba | 0.0 /100 | #325 | Tragic $80,662 |
| Dominicans | 0.0 /100 | #326 | Tragic $80,623 |
| Seminole | 0.0 /100 | #327 | Tragic $80,077 |
Demographics Similar to Immigrants from Grenada by Householder Income Ages 45 - 64 years
In terms of householder income ages 45 - 64 years, the demographic groups most similar to Immigrants from Grenada are British West Indian ($85,571, a difference of 0.020%), Comanche ($85,787, a difference of 0.27%), Immigrants from Zaire ($85,207, a difference of 0.40%), Fijian ($85,187, a difference of 0.43%), and Immigrants from Central America ($85,965, a difference of 0.48%).
| Demographics | Rating | Rank | Householder Income Ages 45 - 64 years |
| Immigrants | St. Vincent and the Grenadines | 0.1 /100 | #288 | Tragic $86,394 |
| Cubans | 0.1 /100 | #289 | Tragic $86,301 |
| Cherokee | 0.1 /100 | #290 | Tragic $86,125 |
| Hispanics or Latinos | 0.1 /100 | #291 | Tragic $86,006 |
| Immigrants | Central America | 0.1 /100 | #292 | Tragic $85,965 |
| Comanche | 0.1 /100 | #293 | Tragic $85,787 |
| British West Indians | 0.1 /100 | #294 | Tragic $85,571 |
| Immigrants | Grenada | 0.1 /100 | #295 | Tragic $85,552 |
| Immigrants | Zaire | 0.1 /100 | #296 | Tragic $85,207 |
| Fijians | 0.1 /100 | #297 | Tragic $85,187 |
| Africans | 0.0 /100 | #298 | Tragic $84,925 |
| Immigrants | Mexico | 0.0 /100 | #299 | Tragic $84,910 |
| Indonesians | 0.0 /100 | #300 | Tragic $84,890 |
| Potawatomi | 0.0 /100 | #301 | Tragic $84,613 |
| Haitians | 0.0 /100 | #302 | Tragic $84,384 |