Apache vs Immigrants from Cameroon Wage/Income Gap
COMPARE
Apache
Immigrants from Cameroon
Wage/Income Gap
Wage/Income Gap Comparison
Apache
Immigrants from Cameroon
24.5%
WAGE/INCOME GAP
94.8/ 100
METRIC RATING
122nd/ 347
METRIC RANK
22.2%
WAGE/INCOME GAP
100.0/ 100
METRIC RATING
52nd/ 347
METRIC RANK
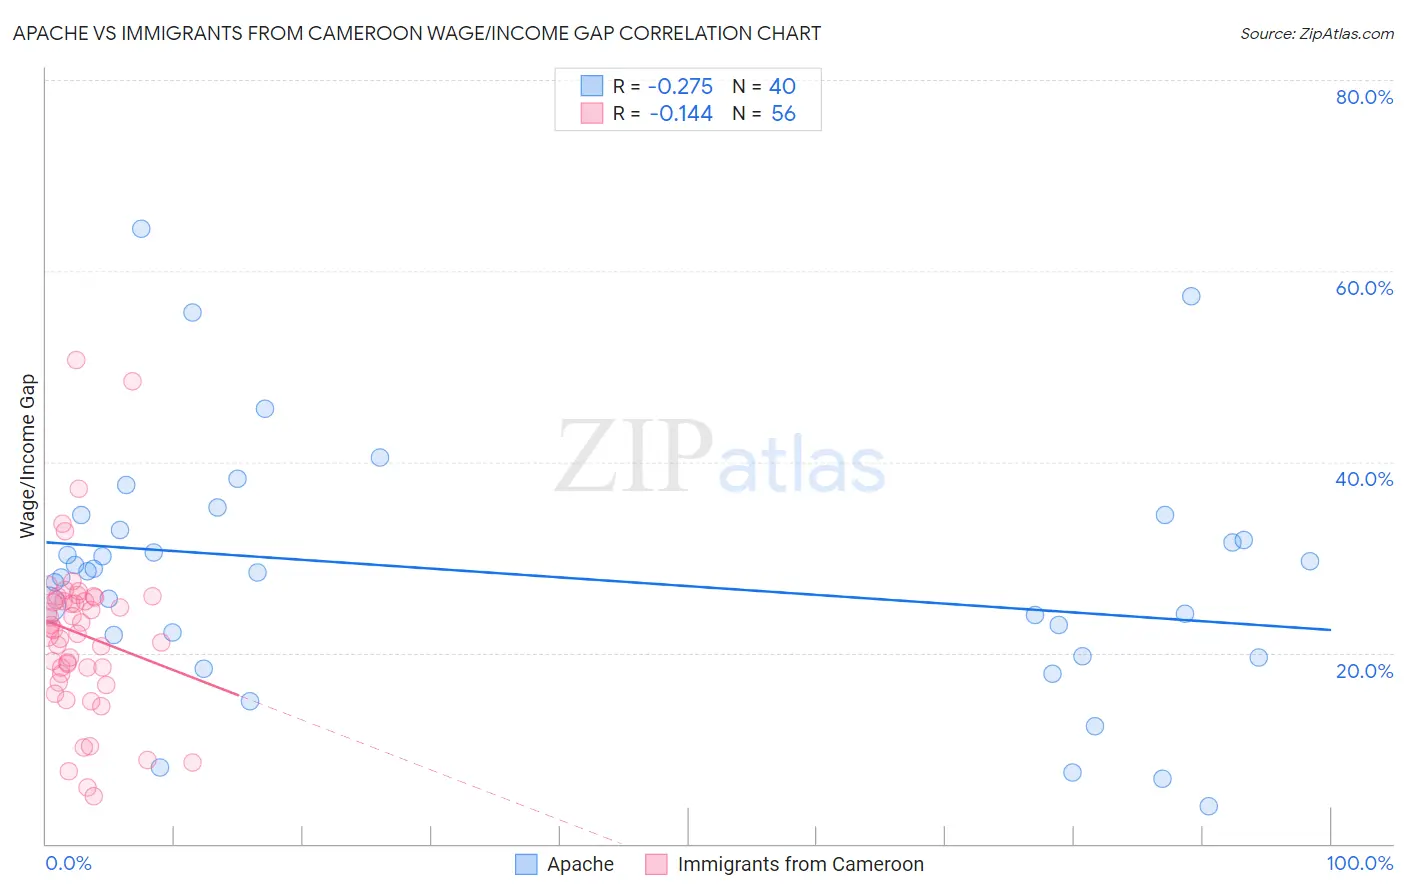
Apache vs Immigrants from Cameroon Wage/Income Gap Correlation Chart
The statistical analysis conducted on geographies consisting of 230,929,884 people shows a weak negative correlation between the proportion of Apache and wage/income gap percentage in the United States with a correlation coefficient (R) of -0.275 and weighted average of 24.5%. Similarly, the statistical analysis conducted on geographies consisting of 130,750,722 people shows a poor negative correlation between the proportion of Immigrants from Cameroon and wage/income gap percentage in the United States with a correlation coefficient (R) of -0.144 and weighted average of 22.2%, a difference of 10.8%.
Wage/Income Gap Correlation Summary
| Measurement | Apache | Immigrants from Cameroon |
| Minimum | 3.9% | 5.0% |
| Maximum | 64.5% | 50.6% |
| Range | 60.6% | 45.7% |
| Mean | 28.1% | 22.0% |
| Median | 28.5% | 22.5% |
| Interquartile 25% (IQ1) | 20.8% | 18.2% |
| Interquartile 75% (IQ3) | 33.7% | 25.6% |
| Interquartile Range (IQR) | 12.9% | 7.5% |
| Standard Deviation (Sample) | 13.0% | 8.5% |
| Standard Deviation (Population) | 12.8% | 8.5% |
Similar Demographics by Wage/Income Gap
Demographics Similar to Apache by Wage/Income Gap
In terms of wage/income gap, the demographic groups most similar to Apache are Immigrants from Thailand (24.5%, a difference of 0.050%), Native/Alaskan (24.6%, a difference of 0.070%), Immigrants from South America (24.6%, a difference of 0.28%), Spanish American (24.6%, a difference of 0.30%), and Cree (24.5%, a difference of 0.31%).
| Demographics | Rating | Rank | Wage/Income Gap |
| Immigrants | Kenya | 96.4 /100 | #115 | Exceptional 24.4% |
| Alaska Natives | 96.0 /100 | #116 | Exceptional 24.4% |
| Immigrants | Afghanistan | 95.9 /100 | #117 | Exceptional 24.4% |
| Immigrants | Micronesia | 95.8 /100 | #118 | Exceptional 24.4% |
| Kenyans | 95.8 /100 | #119 | Exceptional 24.5% |
| Cree | 95.6 /100 | #120 | Exceptional 24.5% |
| Immigrants | Thailand | 94.9 /100 | #121 | Exceptional 24.5% |
| Apache | 94.8 /100 | #122 | Exceptional 24.5% |
| Natives/Alaskans | 94.6 /100 | #123 | Exceptional 24.6% |
| Immigrants | South America | 93.9 /100 | #124 | Exceptional 24.6% |
| Spanish Americans | 93.8 /100 | #125 | Exceptional 24.6% |
| Immigrants | Uruguay | 93.8 /100 | #126 | Exceptional 24.6% |
| German Russians | 93.7 /100 | #127 | Exceptional 24.6% |
| Immigrants | Central America | 93.5 /100 | #128 | Exceptional 24.6% |
| Yup'ik | 93.3 /100 | #129 | Exceptional 24.7% |
Demographics Similar to Immigrants from Cameroon by Wage/Income Gap
In terms of wage/income gap, the demographic groups most similar to Immigrants from Cameroon are Bangladeshi (22.2%, a difference of 0.010%), Tohono O'odham (22.1%, a difference of 0.080%), Nepalese (22.2%, a difference of 0.24%), Immigrants from Western Africa (22.0%, a difference of 0.52%), and Immigrants from Zaire (22.3%, a difference of 0.64%).
| Demographics | Rating | Rank | Wage/Income Gap |
| U.S. Virgin Islanders | 100.0 /100 | #45 | Exceptional 21.5% |
| Immigrants | Ethiopia | 100.0 /100 | #46 | Exceptional 21.6% |
| Immigrants | Congo | 100.0 /100 | #47 | Exceptional 21.7% |
| Blacks/African Americans | 100.0 /100 | #48 | Exceptional 21.7% |
| Ethiopians | 100.0 /100 | #49 | Exceptional 21.8% |
| Immigrants | Western Africa | 100.0 /100 | #50 | Exceptional 22.0% |
| Tohono O'odham | 100.0 /100 | #51 | Exceptional 22.1% |
| Immigrants | Cameroon | 100.0 /100 | #52 | Exceptional 22.2% |
| Bangladeshis | 100.0 /100 | #53 | Exceptional 22.2% |
| Nepalese | 100.0 /100 | #54 | Exceptional 22.2% |
| Immigrants | Zaire | 100.0 /100 | #55 | Exceptional 22.3% |
| Immigrants | Ghana | 100.0 /100 | #56 | Exceptional 22.3% |
| Ghanaians | 100.0 /100 | #57 | Exceptional 22.3% |
| Immigrants | Cuba | 100.0 /100 | #58 | Exceptional 22.4% |
| Navajo | 100.0 /100 | #59 | Exceptional 22.4% |