Apache vs Immigrants from Denmark Wage/Income Gap
COMPARE
Apache
Immigrants from Denmark
Wage/Income Gap
Wage/Income Gap Comparison
Apache
Immigrants from Denmark
24.5%
WAGE/INCOME GAP
94.8/ 100
METRIC RATING
122nd/ 347
METRIC RANK
28.5%
WAGE/INCOME GAP
0.1/ 100
METRIC RATING
307th/ 347
METRIC RANK
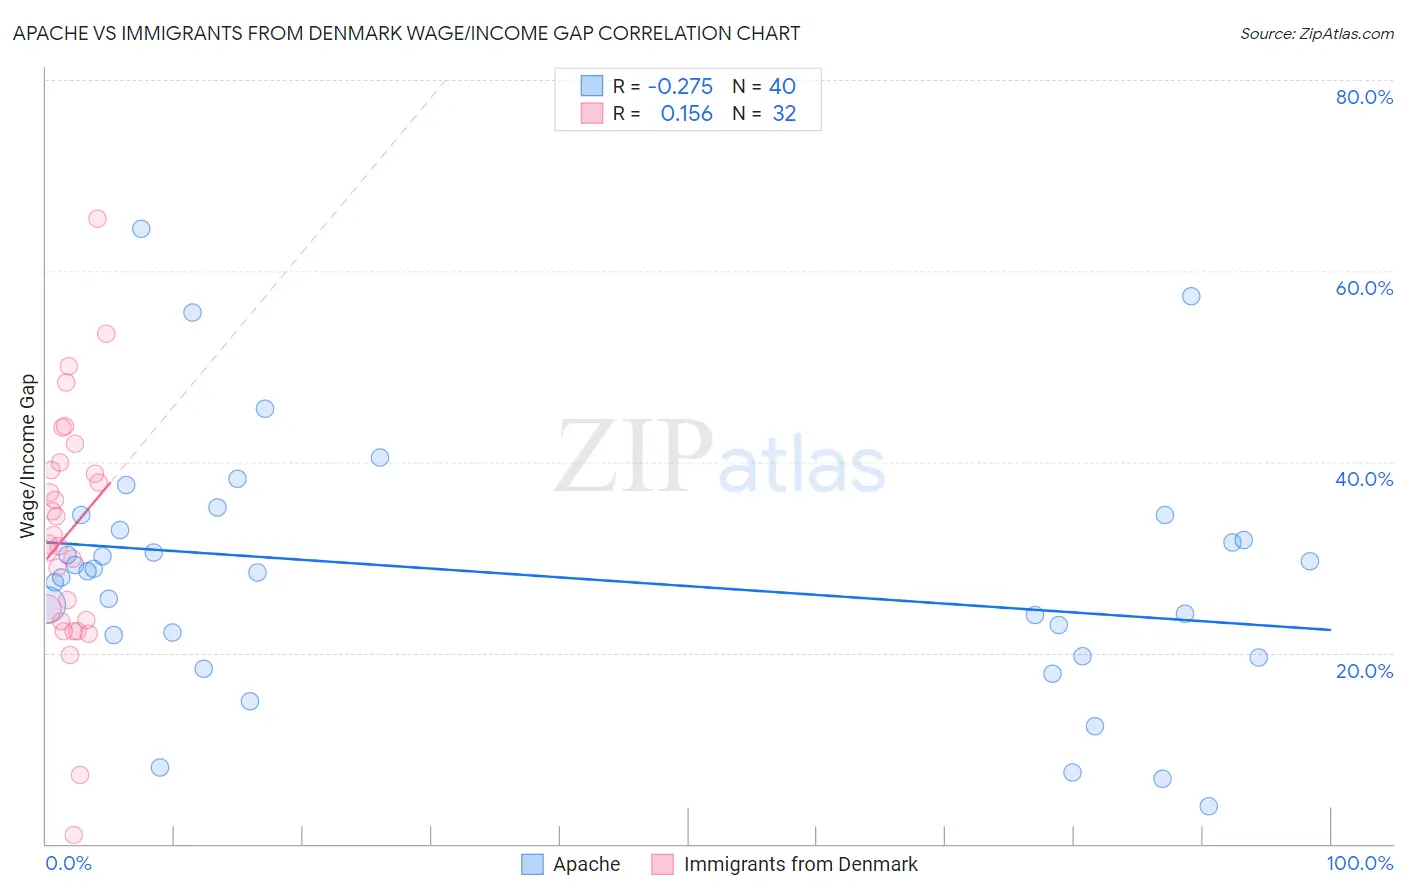
Apache vs Immigrants from Denmark Wage/Income Gap Correlation Chart
The statistical analysis conducted on geographies consisting of 230,929,884 people shows a weak negative correlation between the proportion of Apache and wage/income gap percentage in the United States with a correlation coefficient (R) of -0.275 and weighted average of 24.5%. Similarly, the statistical analysis conducted on geographies consisting of 136,393,196 people shows a poor positive correlation between the proportion of Immigrants from Denmark and wage/income gap percentage in the United States with a correlation coefficient (R) of 0.156 and weighted average of 28.5%, a difference of 16.2%.
Wage/Income Gap Correlation Summary
| Measurement | Apache | Immigrants from Denmark |
| Minimum | 3.9% | 0.92% |
| Maximum | 64.5% | 65.5% |
| Range | 60.6% | 64.6% |
| Mean | 28.1% | 32.6% |
| Median | 28.5% | 31.9% |
| Interquartile 25% (IQ1) | 20.8% | 23.4% |
| Interquartile 75% (IQ3) | 33.7% | 39.5% |
| Interquartile Range (IQR) | 12.9% | 16.2% |
| Standard Deviation (Sample) | 13.0% | 12.9% |
| Standard Deviation (Population) | 12.8% | 12.7% |
Similar Demographics by Wage/Income Gap
Demographics Similar to Apache by Wage/Income Gap
In terms of wage/income gap, the demographic groups most similar to Apache are Immigrants from Thailand (24.5%, a difference of 0.050%), Native/Alaskan (24.6%, a difference of 0.070%), Immigrants from South America (24.6%, a difference of 0.28%), Spanish American (24.6%, a difference of 0.30%), and Cree (24.5%, a difference of 0.31%).
| Demographics | Rating | Rank | Wage/Income Gap |
| Immigrants | Kenya | 96.4 /100 | #115 | Exceptional 24.4% |
| Alaska Natives | 96.0 /100 | #116 | Exceptional 24.4% |
| Immigrants | Afghanistan | 95.9 /100 | #117 | Exceptional 24.4% |
| Immigrants | Micronesia | 95.8 /100 | #118 | Exceptional 24.4% |
| Kenyans | 95.8 /100 | #119 | Exceptional 24.5% |
| Cree | 95.6 /100 | #120 | Exceptional 24.5% |
| Immigrants | Thailand | 94.9 /100 | #121 | Exceptional 24.5% |
| Apache | 94.8 /100 | #122 | Exceptional 24.5% |
| Natives/Alaskans | 94.6 /100 | #123 | Exceptional 24.6% |
| Immigrants | South America | 93.9 /100 | #124 | Exceptional 24.6% |
| Spanish Americans | 93.8 /100 | #125 | Exceptional 24.6% |
| Immigrants | Uruguay | 93.8 /100 | #126 | Exceptional 24.6% |
| German Russians | 93.7 /100 | #127 | Exceptional 24.6% |
| Immigrants | Central America | 93.5 /100 | #128 | Exceptional 24.6% |
| Yup'ik | 93.3 /100 | #129 | Exceptional 24.7% |
Demographics Similar to Immigrants from Denmark by Wage/Income Gap
In terms of wage/income gap, the demographic groups most similar to Immigrants from Denmark are White/Caucasian (28.5%, a difference of 0.010%), Immigrants from South Africa (28.5%, a difference of 0.050%), Immigrants from Netherlands (28.5%, a difference of 0.070%), Polish (28.5%, a difference of 0.070%), and Scotch-Irish (28.5%, a difference of 0.15%).
| Demographics | Rating | Rank | Wage/Income Gap |
| Immigrants | Northern Europe | 0.2 /100 | #300 | Tragic 28.5% |
| Immigrants | Canada | 0.2 /100 | #301 | Tragic 28.5% |
| Scotch-Irish | 0.2 /100 | #302 | Tragic 28.5% |
| Irish | 0.2 /100 | #303 | Tragic 28.5% |
| Immigrants | Netherlands | 0.2 /100 | #304 | Tragic 28.5% |
| Immigrants | South Africa | 0.1 /100 | #305 | Tragic 28.5% |
| Whites/Caucasians | 0.1 /100 | #306 | Tragic 28.5% |
| Immigrants | Denmark | 0.1 /100 | #307 | Tragic 28.5% |
| Poles | 0.1 /100 | #308 | Tragic 28.5% |
| Macedonians | 0.1 /100 | #309 | Tragic 28.6% |
| Finns | 0.1 /100 | #310 | Tragic 28.6% |
| Immigrants | Lithuania | 0.1 /100 | #311 | Tragic 28.6% |
| Eastern Europeans | 0.1 /100 | #312 | Tragic 28.6% |
| French | 0.1 /100 | #313 | Tragic 28.7% |
| Immigrants | Scotland | 0.1 /100 | #314 | Tragic 28.7% |