Apache vs Bulgarian Wage/Income Gap
COMPARE
Apache
Bulgarian
Wage/Income Gap
Wage/Income Gap Comparison
Apache
Bulgarians
24.5%
WAGE/INCOME GAP
94.8/ 100
METRIC RATING
122nd/ 347
METRIC RANK
27.8%
WAGE/INCOME GAP
0.7/ 100
METRIC RATING
273rd/ 347
METRIC RANK
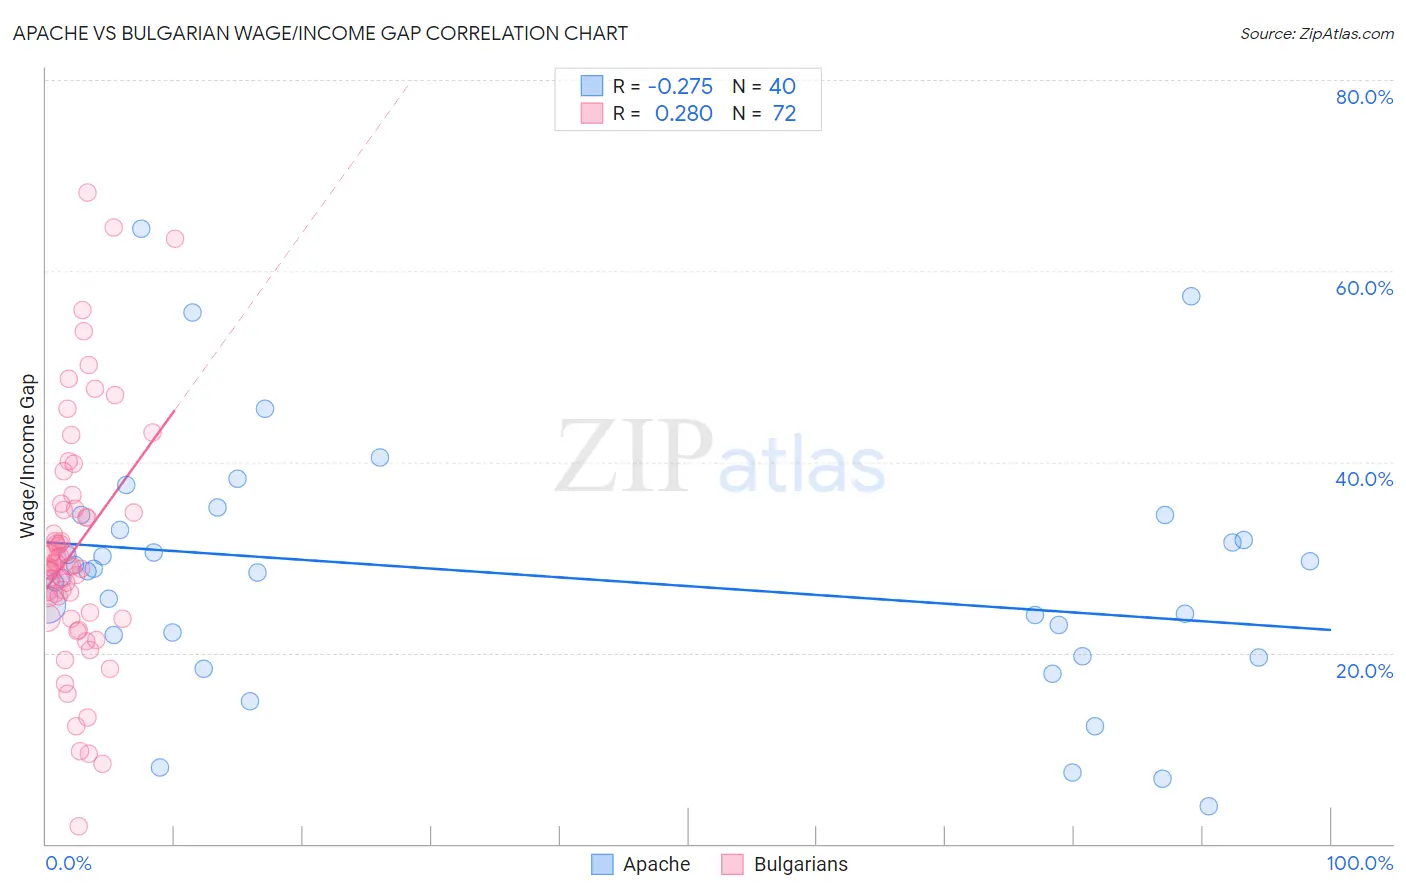
Apache vs Bulgarian Wage/Income Gap Correlation Chart
The statistical analysis conducted on geographies consisting of 230,929,884 people shows a weak negative correlation between the proportion of Apache and wage/income gap percentage in the United States with a correlation coefficient (R) of -0.275 and weighted average of 24.5%. Similarly, the statistical analysis conducted on geographies consisting of 205,588,270 people shows a weak positive correlation between the proportion of Bulgarians and wage/income gap percentage in the United States with a correlation coefficient (R) of 0.280 and weighted average of 27.8%, a difference of 13.4%.
Wage/Income Gap Correlation Summary
| Measurement | Apache | Bulgarian |
| Minimum | 3.9% | 1.9% |
| Maximum | 64.5% | 68.2% |
| Range | 60.6% | 66.3% |
| Mean | 28.1% | 30.9% |
| Median | 28.5% | 29.1% |
| Interquartile 25% (IQ1) | 20.8% | 23.9% |
| Interquartile 75% (IQ3) | 33.7% | 35.1% |
| Interquartile Range (IQR) | 12.9% | 11.1% |
| Standard Deviation (Sample) | 13.0% | 12.6% |
| Standard Deviation (Population) | 12.8% | 12.5% |
Similar Demographics by Wage/Income Gap
Demographics Similar to Apache by Wage/Income Gap
In terms of wage/income gap, the demographic groups most similar to Apache are Immigrants from Thailand (24.5%, a difference of 0.050%), Native/Alaskan (24.6%, a difference of 0.070%), Immigrants from South America (24.6%, a difference of 0.28%), Spanish American (24.6%, a difference of 0.30%), and Cree (24.5%, a difference of 0.31%).
| Demographics | Rating | Rank | Wage/Income Gap |
| Immigrants | Kenya | 96.4 /100 | #115 | Exceptional 24.4% |
| Alaska Natives | 96.0 /100 | #116 | Exceptional 24.4% |
| Immigrants | Afghanistan | 95.9 /100 | #117 | Exceptional 24.4% |
| Immigrants | Micronesia | 95.8 /100 | #118 | Exceptional 24.4% |
| Kenyans | 95.8 /100 | #119 | Exceptional 24.5% |
| Cree | 95.6 /100 | #120 | Exceptional 24.5% |
| Immigrants | Thailand | 94.9 /100 | #121 | Exceptional 24.5% |
| Apache | 94.8 /100 | #122 | Exceptional 24.5% |
| Natives/Alaskans | 94.6 /100 | #123 | Exceptional 24.6% |
| Immigrants | South America | 93.9 /100 | #124 | Exceptional 24.6% |
| Spanish Americans | 93.8 /100 | #125 | Exceptional 24.6% |
| Immigrants | Uruguay | 93.8 /100 | #126 | Exceptional 24.6% |
| German Russians | 93.7 /100 | #127 | Exceptional 24.6% |
| Immigrants | Central America | 93.5 /100 | #128 | Exceptional 24.6% |
| Yup'ik | 93.3 /100 | #129 | Exceptional 24.7% |
Demographics Similar to Bulgarians by Wage/Income Gap
In terms of wage/income gap, the demographic groups most similar to Bulgarians are American (27.8%, a difference of 0.040%), Immigrants from Korea (27.8%, a difference of 0.11%), Immigrants from Japan (27.9%, a difference of 0.12%), Lebanese (27.9%, a difference of 0.15%), and Latvian (27.9%, a difference of 0.15%).
| Demographics | Rating | Rank | Wage/Income Gap |
| Hmong | 1.0 /100 | #266 | Tragic 27.7% |
| Turks | 1.0 /100 | #267 | Tragic 27.7% |
| New Zealanders | 1.0 /100 | #268 | Tragic 27.7% |
| Potawatomi | 0.9 /100 | #269 | Tragic 27.7% |
| Immigrants | Western Europe | 0.9 /100 | #270 | Tragic 27.8% |
| Ute | 0.8 /100 | #271 | Tragic 27.8% |
| Immigrants | Korea | 0.8 /100 | #272 | Tragic 27.8% |
| Bulgarians | 0.7 /100 | #273 | Tragic 27.8% |
| Americans | 0.7 /100 | #274 | Tragic 27.8% |
| Immigrants | Japan | 0.7 /100 | #275 | Tragic 27.9% |
| Lebanese | 0.7 /100 | #276 | Tragic 27.9% |
| Latvians | 0.7 /100 | #277 | Tragic 27.9% |
| Immigrants | England | 0.6 /100 | #278 | Tragic 27.9% |
| Romanians | 0.5 /100 | #279 | Tragic 28.0% |
| Russians | 0.5 /100 | #280 | Tragic 28.0% |