Alsatian vs Immigrants from North Macedonia Per Capita Income
COMPARE
Alsatian
Immigrants from North Macedonia
Per Capita Income
Per Capita Income Comparison
Alsatians
Immigrants from North Macedonia
$47,284
PER CAPITA INCOME
98.3/ 100
METRIC RATING
96th/ 347
METRIC RANK
$45,622
PER CAPITA INCOME
90.0/ 100
METRIC RATING
131st/ 347
METRIC RANK
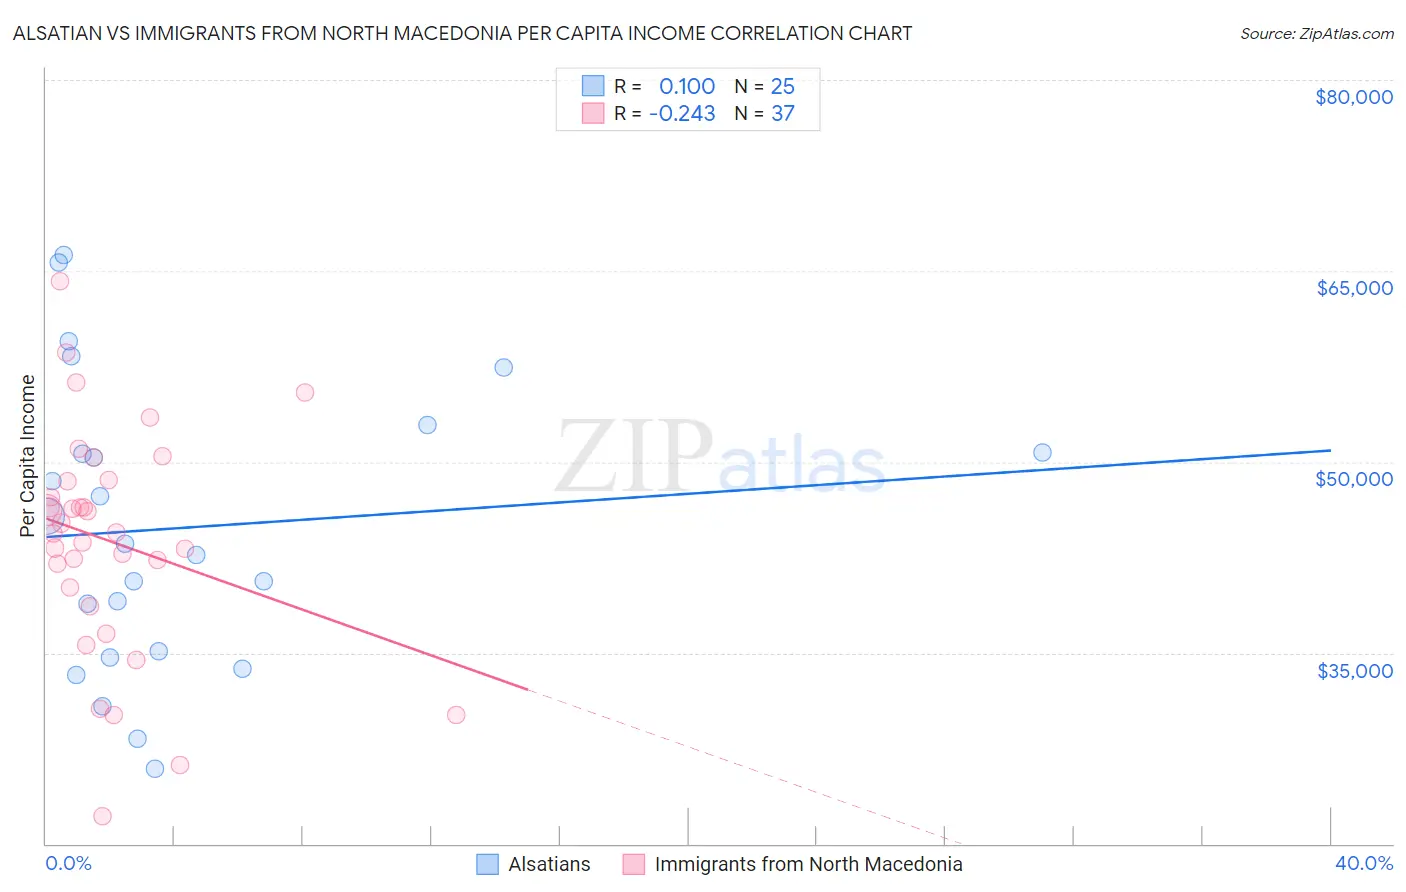
Alsatian vs Immigrants from North Macedonia Per Capita Income Correlation Chart
The statistical analysis conducted on geographies consisting of 82,682,365 people shows a slight positive correlation between the proportion of Alsatians and per capita income in the United States with a correlation coefficient (R) of 0.100 and weighted average of $47,284. Similarly, the statistical analysis conducted on geographies consisting of 74,060,501 people shows a weak negative correlation between the proportion of Immigrants from North Macedonia and per capita income in the United States with a correlation coefficient (R) of -0.243 and weighted average of $45,622, a difference of 3.6%.
Per Capita Income Correlation Summary
| Measurement | Alsatian | Immigrants from North Macedonia |
| Minimum | $25,853 | $22,118 |
| Maximum | $66,221 | $64,214 |
| Range | $40,368 | $42,096 |
| Mean | $44,810 | $43,782 |
| Median | $43,610 | $44,497 |
| Interquartile 25% (IQ1) | $34,894 | $39,397 |
| Interquartile 75% (IQ3) | $51,799 | $48,508 |
| Interquartile Range (IQR) | $16,905 | $9,111 |
| Standard Deviation (Sample) | $11,224 | $8,887 |
| Standard Deviation (Population) | $10,998 | $8,766 |
Similar Demographics by Per Capita Income
Demographics Similar to Alsatians by Per Capita Income
In terms of per capita income, the demographic groups most similar to Alsatians are Carpatho Rusyn ($47,248, a difference of 0.080%), Immigrants from Egypt ($47,361, a difference of 0.16%), Albanian ($47,379, a difference of 0.20%), Immigrants from Zimbabwe ($47,394, a difference of 0.23%), and Immigrants from Moldova ($47,489, a difference of 0.43%).
| Demographics | Rating | Rank | Per Capita Income |
| Northern Europeans | 98.9 /100 | #89 | Exceptional $47,698 |
| Italians | 98.8 /100 | #90 | Exceptional $47,574 |
| Macedonians | 98.8 /100 | #91 | Exceptional $47,573 |
| Immigrants | Moldova | 98.7 /100 | #92 | Exceptional $47,489 |
| Immigrants | Zimbabwe | 98.5 /100 | #93 | Exceptional $47,394 |
| Albanians | 98.5 /100 | #94 | Exceptional $47,379 |
| Immigrants | Egypt | 98.5 /100 | #95 | Exceptional $47,361 |
| Alsatians | 98.3 /100 | #96 | Exceptional $47,284 |
| Carpatho Rusyns | 98.2 /100 | #97 | Exceptional $47,248 |
| Immigrants | Pakistan | 97.9 /100 | #98 | Exceptional $47,084 |
| Laotians | 97.8 /100 | #99 | Exceptional $47,041 |
| Immigrants | Lebanon | 97.5 /100 | #100 | Exceptional $46,938 |
| Immigrants | Uzbekistan | 97.5 /100 | #101 | Exceptional $46,929 |
| Immigrants | Western Asia | 97.4 /100 | #102 | Exceptional $46,876 |
| Syrians | 97.2 /100 | #103 | Exceptional $46,837 |
Demographics Similar to Immigrants from North Macedonia by Per Capita Income
In terms of per capita income, the demographic groups most similar to Immigrants from North Macedonia are Jordanian ($45,605, a difference of 0.040%), Pakistani ($45,587, a difference of 0.080%), Luxembourger ($45,663, a difference of 0.090%), Arab ($45,662, a difference of 0.090%), and Slovene ($45,581, a difference of 0.090%).
| Demographics | Rating | Rank | Per Capita Income |
| Europeans | 92.0 /100 | #124 | Exceptional $45,836 |
| Zimbabweans | 91.7 /100 | #125 | Exceptional $45,804 |
| Palestinians | 91.6 /100 | #126 | Exceptional $45,790 |
| Immigrants | Germany | 91.3 /100 | #127 | Exceptional $45,751 |
| Swedes | 91.3 /100 | #128 | Exceptional $45,750 |
| Luxembourgers | 90.4 /100 | #129 | Exceptional $45,663 |
| Arabs | 90.4 /100 | #130 | Exceptional $45,662 |
| Immigrants | North Macedonia | 90.0 /100 | #131 | Exceptional $45,622 |
| Jordanians | 89.9 /100 | #132 | Excellent $45,605 |
| Pakistanis | 89.7 /100 | #133 | Excellent $45,587 |
| Slovenes | 89.6 /100 | #134 | Excellent $45,581 |
| Hungarians | 87.9 /100 | #135 | Excellent $45,426 |
| Immigrants | Oceania | 85.2 /100 | #136 | Excellent $45,220 |
| Immigrants | Syria | 85.2 /100 | #137 | Excellent $45,218 |
| Assyrians/Chaldeans/Syriacs | 84.8 /100 | #138 | Excellent $45,195 |