Alsatian vs Immigrants from Netherlands Per Capita Income
COMPARE
Alsatian
Immigrants from Netherlands
Per Capita Income
Per Capita Income Comparison
Alsatians
Immigrants from Netherlands
$47,284
PER CAPITA INCOME
98.3/ 100
METRIC RATING
96th/ 347
METRIC RANK
$50,458
PER CAPITA INCOME
100.0/ 100
METRIC RATING
51st/ 347
METRIC RANK
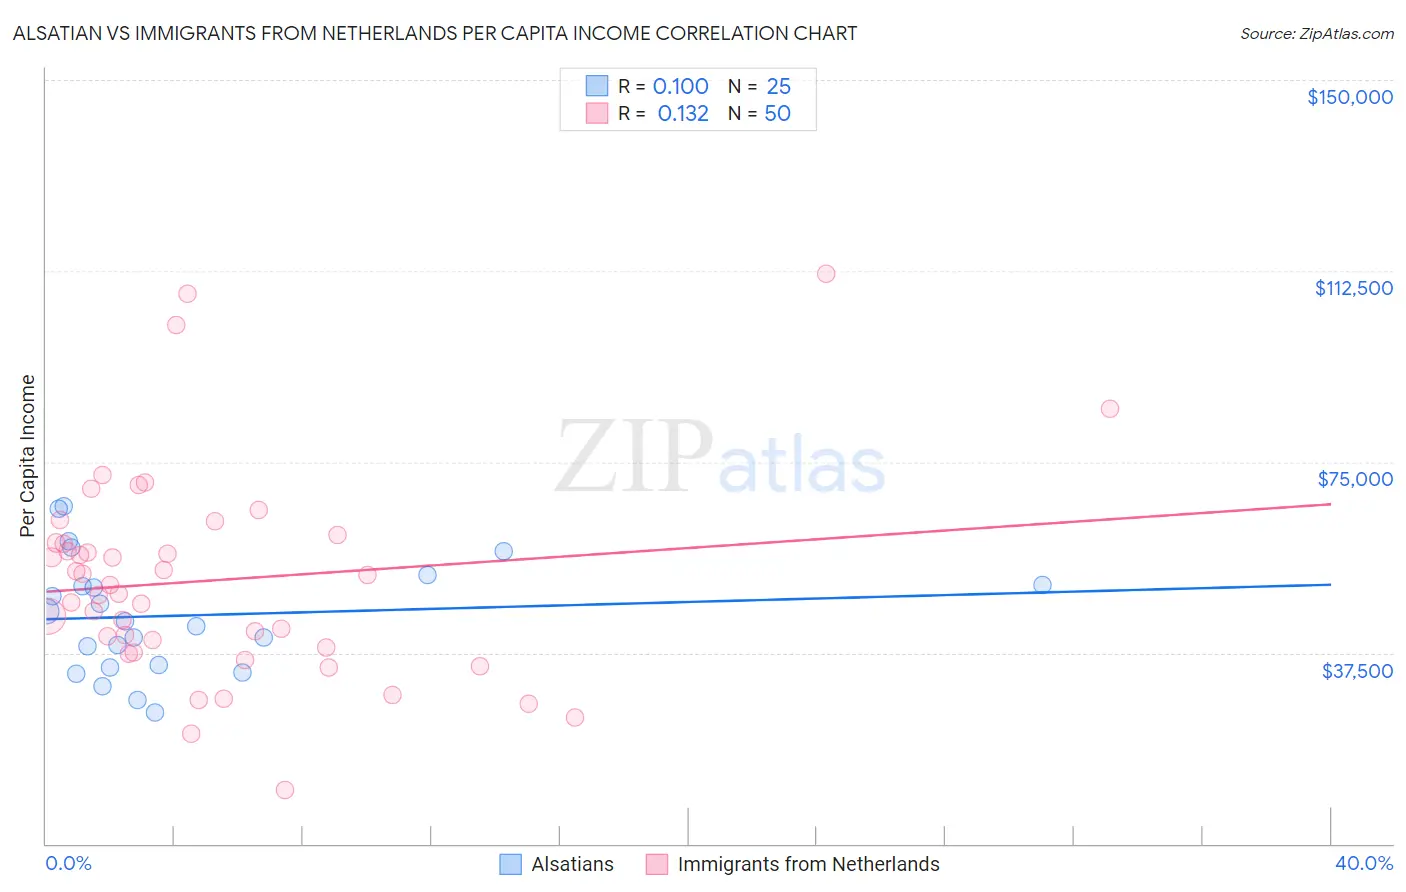
Alsatian vs Immigrants from Netherlands Per Capita Income Correlation Chart
The statistical analysis conducted on geographies consisting of 82,682,365 people shows a slight positive correlation between the proportion of Alsatians and per capita income in the United States with a correlation coefficient (R) of 0.100 and weighted average of $47,284. Similarly, the statistical analysis conducted on geographies consisting of 237,881,407 people shows a poor positive correlation between the proportion of Immigrants from Netherlands and per capita income in the United States with a correlation coefficient (R) of 0.132 and weighted average of $50,458, a difference of 6.7%.
Per Capita Income Correlation Summary
| Measurement | Alsatian | Immigrants from Netherlands |
| Minimum | $25,853 | $10,464 |
| Maximum | $66,221 | $111,976 |
| Range | $40,368 | $101,512 |
| Mean | $44,810 | $51,773 |
| Median | $43,610 | $49,974 |
| Interquartile 25% (IQ1) | $34,894 | $38,654 |
| Interquartile 75% (IQ3) | $51,799 | $59,110 |
| Interquartile Range (IQR) | $16,905 | $20,456 |
| Standard Deviation (Sample) | $11,224 | $20,417 |
| Standard Deviation (Population) | $10,998 | $20,212 |
Similar Demographics by Per Capita Income
Demographics Similar to Alsatians by Per Capita Income
In terms of per capita income, the demographic groups most similar to Alsatians are Carpatho Rusyn ($47,248, a difference of 0.080%), Immigrants from Egypt ($47,361, a difference of 0.16%), Albanian ($47,379, a difference of 0.20%), Immigrants from Zimbabwe ($47,394, a difference of 0.23%), and Immigrants from Moldova ($47,489, a difference of 0.43%).
| Demographics | Rating | Rank | Per Capita Income |
| Northern Europeans | 98.9 /100 | #89 | Exceptional $47,698 |
| Italians | 98.8 /100 | #90 | Exceptional $47,574 |
| Macedonians | 98.8 /100 | #91 | Exceptional $47,573 |
| Immigrants | Moldova | 98.7 /100 | #92 | Exceptional $47,489 |
| Immigrants | Zimbabwe | 98.5 /100 | #93 | Exceptional $47,394 |
| Albanians | 98.5 /100 | #94 | Exceptional $47,379 |
| Immigrants | Egypt | 98.5 /100 | #95 | Exceptional $47,361 |
| Alsatians | 98.3 /100 | #96 | Exceptional $47,284 |
| Carpatho Rusyns | 98.2 /100 | #97 | Exceptional $47,248 |
| Immigrants | Pakistan | 97.9 /100 | #98 | Exceptional $47,084 |
| Laotians | 97.8 /100 | #99 | Exceptional $47,041 |
| Immigrants | Lebanon | 97.5 /100 | #100 | Exceptional $46,938 |
| Immigrants | Uzbekistan | 97.5 /100 | #101 | Exceptional $46,929 |
| Immigrants | Western Asia | 97.4 /100 | #102 | Exceptional $46,876 |
| Syrians | 97.2 /100 | #103 | Exceptional $46,837 |
Demographics Similar to Immigrants from Netherlands by Per Capita Income
In terms of per capita income, the demographic groups most similar to Immigrants from Netherlands are Immigrants from Croatia ($50,417, a difference of 0.080%), Paraguayan ($50,385, a difference of 0.14%), Immigrants from Sri Lanka ($50,555, a difference of 0.19%), New Zealander ($50,575, a difference of 0.23%), and Immigrants from Belarus ($50,303, a difference of 0.31%).
| Demographics | Rating | Rank | Per Capita Income |
| Immigrants | Europe | 100.0 /100 | #44 | Exceptional $50,950 |
| Immigrants | Spain | 100.0 /100 | #45 | Exceptional $50,933 |
| Immigrants | Latvia | 100.0 /100 | #46 | Exceptional $50,914 |
| Bulgarians | 100.0 /100 | #47 | Exceptional $50,906 |
| Immigrants | Serbia | 100.0 /100 | #48 | Exceptional $50,810 |
| New Zealanders | 100.0 /100 | #49 | Exceptional $50,575 |
| Immigrants | Sri Lanka | 100.0 /100 | #50 | Exceptional $50,555 |
| Immigrants | Netherlands | 100.0 /100 | #51 | Exceptional $50,458 |
| Immigrants | Croatia | 99.9 /100 | #52 | Exceptional $50,417 |
| Paraguayans | 99.9 /100 | #53 | Exceptional $50,385 |
| Immigrants | Belarus | 99.9 /100 | #54 | Exceptional $50,303 |
| Immigrants | Western Europe | 99.9 /100 | #55 | Exceptional $50,065 |
| Asians | 99.9 /100 | #56 | Exceptional $50,057 |
| South Africans | 99.9 /100 | #57 | Exceptional $50,044 |
| Immigrants | Malaysia | 99.9 /100 | #58 | Exceptional $49,983 |