Alsatian vs Syrian Per Capita Income
COMPARE
Alsatian
Syrian
Per Capita Income
Per Capita Income Comparison
Alsatians
Syrians
$47,284
PER CAPITA INCOME
98.3/ 100
METRIC RATING
96th/ 347
METRIC RANK
$46,837
PER CAPITA INCOME
97.2/ 100
METRIC RATING
103rd/ 347
METRIC RANK
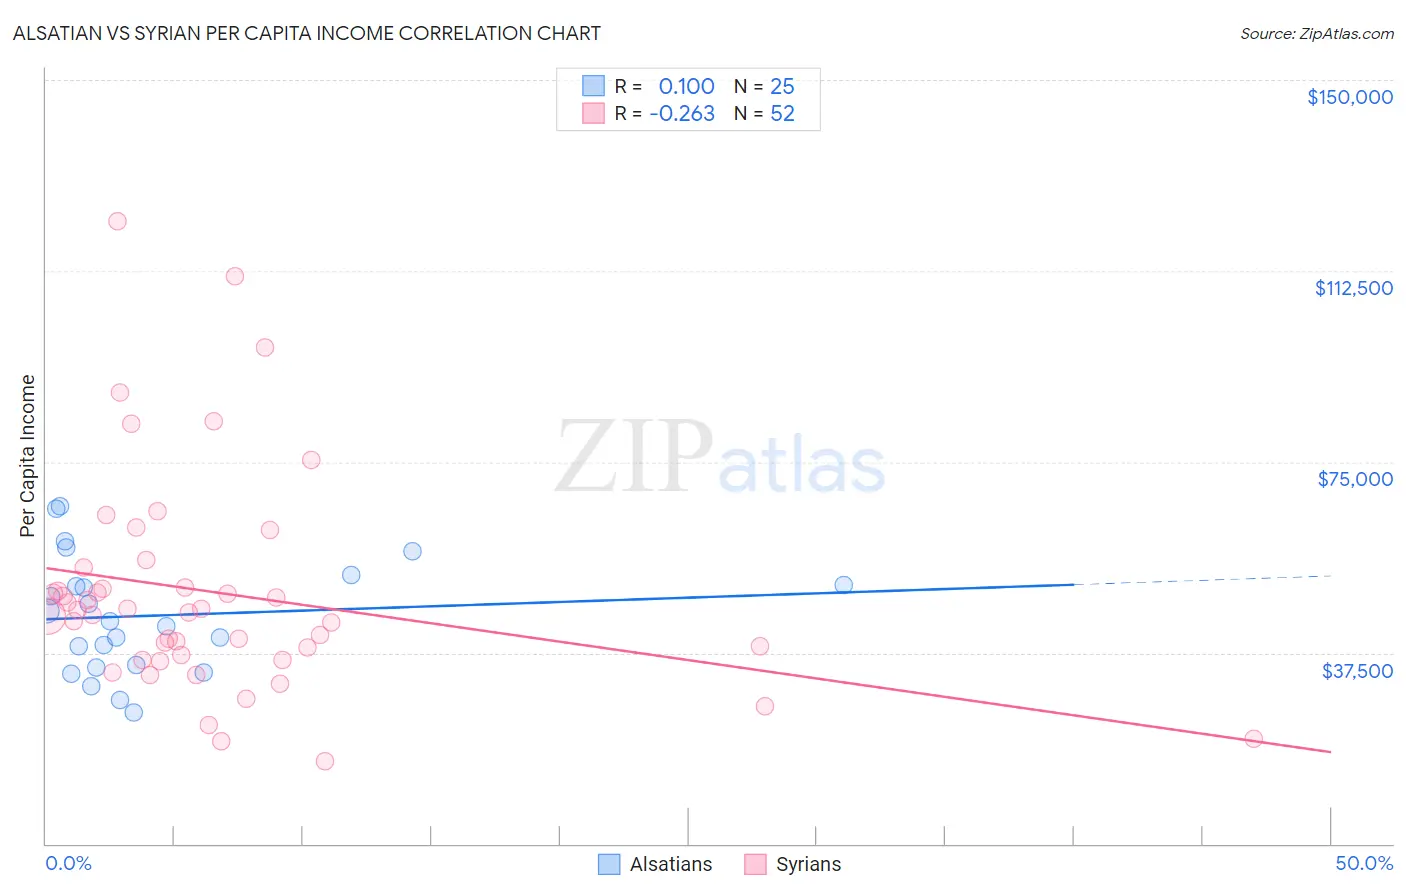
Alsatian vs Syrian Per Capita Income Correlation Chart
The statistical analysis conducted on geographies consisting of 82,682,365 people shows a slight positive correlation between the proportion of Alsatians and per capita income in the United States with a correlation coefficient (R) of 0.100 and weighted average of $47,284. Similarly, the statistical analysis conducted on geographies consisting of 266,332,251 people shows a weak negative correlation between the proportion of Syrians and per capita income in the United States with a correlation coefficient (R) of -0.263 and weighted average of $46,837, a difference of 0.95%.
Per Capita Income Correlation Summary
| Measurement | Alsatian | Syrian |
| Minimum | $25,853 | $16,296 |
| Maximum | $66,221 | $122,379 |
| Range | $40,368 | $106,083 |
| Mean | $44,810 | $49,326 |
| Median | $43,610 | $45,708 |
| Interquartile 25% (IQ1) | $34,894 | $36,580 |
| Interquartile 75% (IQ3) | $51,799 | $52,298 |
| Interquartile Range (IQR) | $16,905 | $15,717 |
| Standard Deviation (Sample) | $11,224 | $21,603 |
| Standard Deviation (Population) | $10,998 | $21,394 |
Demographics Similar to Alsatians and Syrians by Per Capita Income
In terms of per capita income, the demographic groups most similar to Alsatians are Carpatho Rusyn ($47,248, a difference of 0.080%), Immigrants from Egypt ($47,361, a difference of 0.16%), Albanian ($47,379, a difference of 0.20%), Immigrants from Zimbabwe ($47,394, a difference of 0.23%), and Immigrants from Moldova ($47,489, a difference of 0.43%). Similarly, the demographic groups most similar to Syrians are Immigrants from Western Asia ($46,876, a difference of 0.080%), Immigrants from Uzbekistan ($46,929, a difference of 0.20%), Immigrants from Lebanon ($46,938, a difference of 0.22%), Brazilian ($46,700, a difference of 0.29%), and Laotian ($47,041, a difference of 0.43%).
| Demographics | Rating | Rank | Per Capita Income |
| Northern Europeans | 98.9 /100 | #89 | Exceptional $47,698 |
| Italians | 98.8 /100 | #90 | Exceptional $47,574 |
| Macedonians | 98.8 /100 | #91 | Exceptional $47,573 |
| Immigrants | Moldova | 98.7 /100 | #92 | Exceptional $47,489 |
| Immigrants | Zimbabwe | 98.5 /100 | #93 | Exceptional $47,394 |
| Albanians | 98.5 /100 | #94 | Exceptional $47,379 |
| Immigrants | Egypt | 98.5 /100 | #95 | Exceptional $47,361 |
| Alsatians | 98.3 /100 | #96 | Exceptional $47,284 |
| Carpatho Rusyns | 98.2 /100 | #97 | Exceptional $47,248 |
| Immigrants | Pakistan | 97.9 /100 | #98 | Exceptional $47,084 |
| Laotians | 97.8 /100 | #99 | Exceptional $47,041 |
| Immigrants | Lebanon | 97.5 /100 | #100 | Exceptional $46,938 |
| Immigrants | Uzbekistan | 97.5 /100 | #101 | Exceptional $46,929 |
| Immigrants | Western Asia | 97.4 /100 | #102 | Exceptional $46,876 |
| Syrians | 97.2 /100 | #103 | Exceptional $46,837 |
| Brazilians | 96.8 /100 | #104 | Exceptional $46,700 |
| British | 96.3 /100 | #105 | Exceptional $46,571 |
| Ethiopians | 96.3 /100 | #106 | Exceptional $46,569 |
| Serbians | 96.2 /100 | #107 | Exceptional $46,551 |
| Immigrants | Kuwait | 96.2 /100 | #108 | Exceptional $46,543 |
| Immigrants | Northern Africa | 96.2 /100 | #109 | Exceptional $46,531 |