Alsatian vs French American Indian Per Capita Income
COMPARE
Alsatian
French American Indian
Per Capita Income
Per Capita Income Comparison
Alsatians
French American Indians
$47,284
PER CAPITA INCOME
98.3/ 100
METRIC RATING
96th/ 347
METRIC RANK
$40,244
PER CAPITA INCOME
2.1/ 100
METRIC RATING
244th/ 347
METRIC RANK
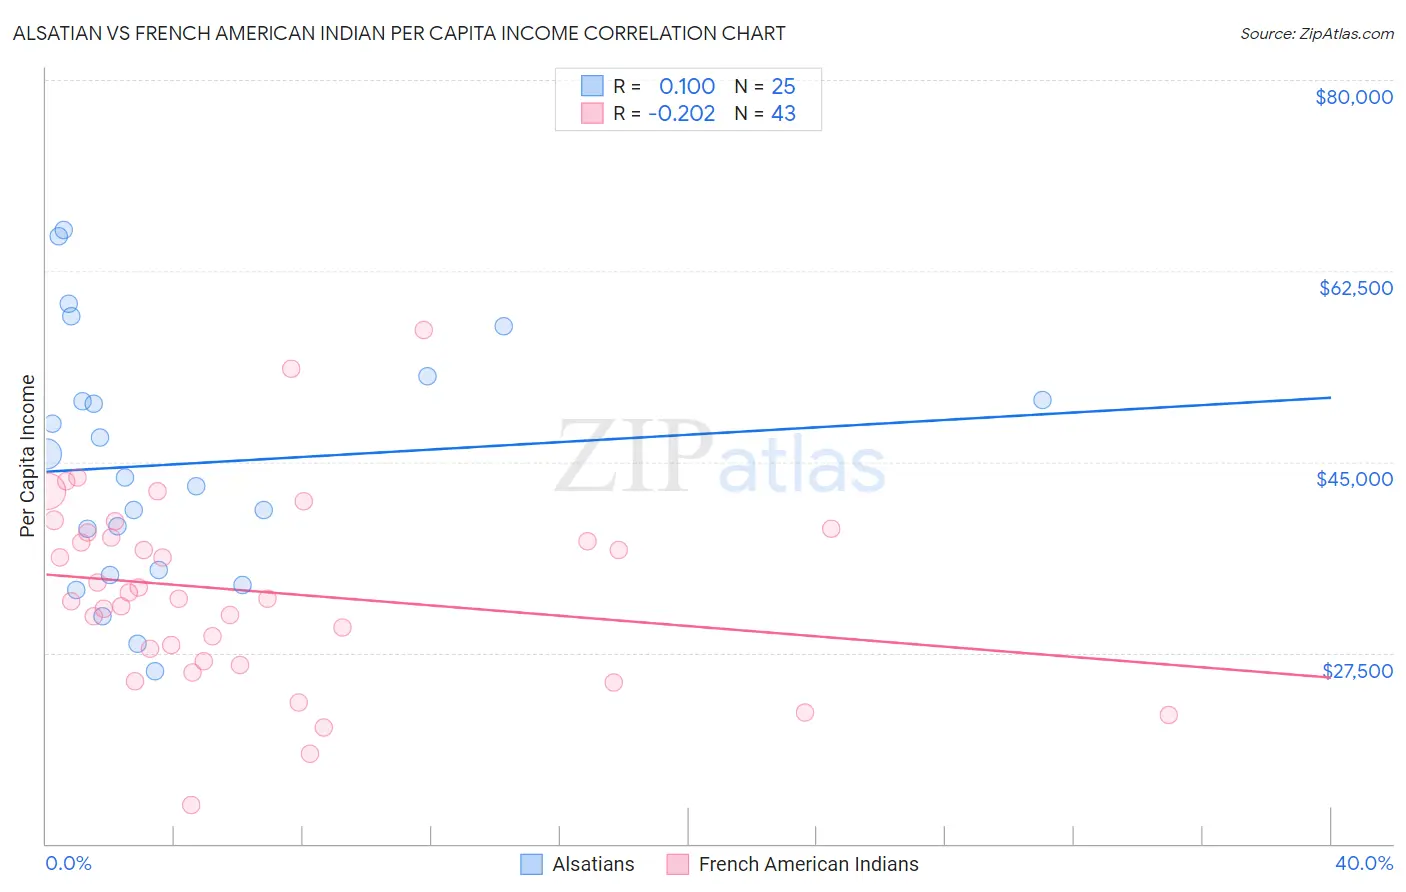
Alsatian vs French American Indian Per Capita Income Correlation Chart
The statistical analysis conducted on geographies consisting of 82,682,365 people shows a slight positive correlation between the proportion of Alsatians and per capita income in the United States with a correlation coefficient (R) of 0.100 and weighted average of $47,284. Similarly, the statistical analysis conducted on geographies consisting of 131,975,147 people shows a weak negative correlation between the proportion of French American Indians and per capita income in the United States with a correlation coefficient (R) of -0.202 and weighted average of $40,244, a difference of 17.5%.
Per Capita Income Correlation Summary
| Measurement | Alsatian | French American Indian |
| Minimum | $25,853 | $13,560 |
| Maximum | $66,221 | $57,062 |
| Range | $40,368 | $43,502 |
| Mean | $44,810 | $33,133 |
| Median | $43,610 | $32,489 |
| Interquartile 25% (IQ1) | $34,894 | $26,698 |
| Interquartile 75% (IQ3) | $51,799 | $38,474 |
| Interquartile Range (IQR) | $16,905 | $11,776 |
| Standard Deviation (Sample) | $11,224 | $8,715 |
| Standard Deviation (Population) | $10,998 | $8,613 |
Similar Demographics by Per Capita Income
Demographics Similar to Alsatians by Per Capita Income
In terms of per capita income, the demographic groups most similar to Alsatians are Carpatho Rusyn ($47,248, a difference of 0.080%), Immigrants from Egypt ($47,361, a difference of 0.16%), Albanian ($47,379, a difference of 0.20%), Immigrants from Zimbabwe ($47,394, a difference of 0.23%), and Immigrants from Moldova ($47,489, a difference of 0.43%).
| Demographics | Rating | Rank | Per Capita Income |
| Northern Europeans | 98.9 /100 | #89 | Exceptional $47,698 |
| Italians | 98.8 /100 | #90 | Exceptional $47,574 |
| Macedonians | 98.8 /100 | #91 | Exceptional $47,573 |
| Immigrants | Moldova | 98.7 /100 | #92 | Exceptional $47,489 |
| Immigrants | Zimbabwe | 98.5 /100 | #93 | Exceptional $47,394 |
| Albanians | 98.5 /100 | #94 | Exceptional $47,379 |
| Immigrants | Egypt | 98.5 /100 | #95 | Exceptional $47,361 |
| Alsatians | 98.3 /100 | #96 | Exceptional $47,284 |
| Carpatho Rusyns | 98.2 /100 | #97 | Exceptional $47,248 |
| Immigrants | Pakistan | 97.9 /100 | #98 | Exceptional $47,084 |
| Laotians | 97.8 /100 | #99 | Exceptional $47,041 |
| Immigrants | Lebanon | 97.5 /100 | #100 | Exceptional $46,938 |
| Immigrants | Uzbekistan | 97.5 /100 | #101 | Exceptional $46,929 |
| Immigrants | Western Asia | 97.4 /100 | #102 | Exceptional $46,876 |
| Syrians | 97.2 /100 | #103 | Exceptional $46,837 |
Demographics Similar to French American Indians by Per Capita Income
In terms of per capita income, the demographic groups most similar to French American Indians are German Russian ($40,266, a difference of 0.060%), Immigrants from Western Africa ($40,294, a difference of 0.13%), British West Indian ($40,330, a difference of 0.21%), Subsaharan African ($40,152, a difference of 0.23%), and Immigrants from Nigeria ($40,339, a difference of 0.24%).
| Demographics | Rating | Rank | Per Capita Income |
| Immigrants | Cambodia | 2.6 /100 | #237 | Tragic $40,434 |
| Somalis | 2.4 /100 | #238 | Tragic $40,367 |
| Tsimshian | 2.4 /100 | #239 | Tragic $40,344 |
| Immigrants | Nigeria | 2.3 /100 | #240 | Tragic $40,339 |
| British West Indians | 2.3 /100 | #241 | Tragic $40,330 |
| Immigrants | Western Africa | 2.2 /100 | #242 | Tragic $40,294 |
| German Russians | 2.2 /100 | #243 | Tragic $40,266 |
| French American Indians | 2.1 /100 | #244 | Tragic $40,244 |
| Sub-Saharan Africans | 1.9 /100 | #245 | Tragic $40,152 |
| Cree | 1.7 /100 | #246 | Tragic $40,056 |
| Immigrants | Somalia | 1.6 /100 | #247 | Tragic $39,974 |
| Cape Verdeans | 1.5 /100 | #248 | Tragic $39,935 |
| Japanese | 1.4 /100 | #249 | Tragic $39,870 |
| Immigrants | Burma/Myanmar | 1.3 /100 | #250 | Tragic $39,827 |
| Samoans | 1.3 /100 | #251 | Tragic $39,826 |