Alsatian vs Immigrants from Sudan Per Capita Income
COMPARE
Alsatian
Immigrants from Sudan
Per Capita Income
Per Capita Income Comparison
Alsatians
Immigrants from Sudan
$47,284
PER CAPITA INCOME
98.3/ 100
METRIC RATING
96th/ 347
METRIC RANK
$41,986
PER CAPITA INCOME
13.2/ 100
METRIC RATING
209th/ 347
METRIC RANK
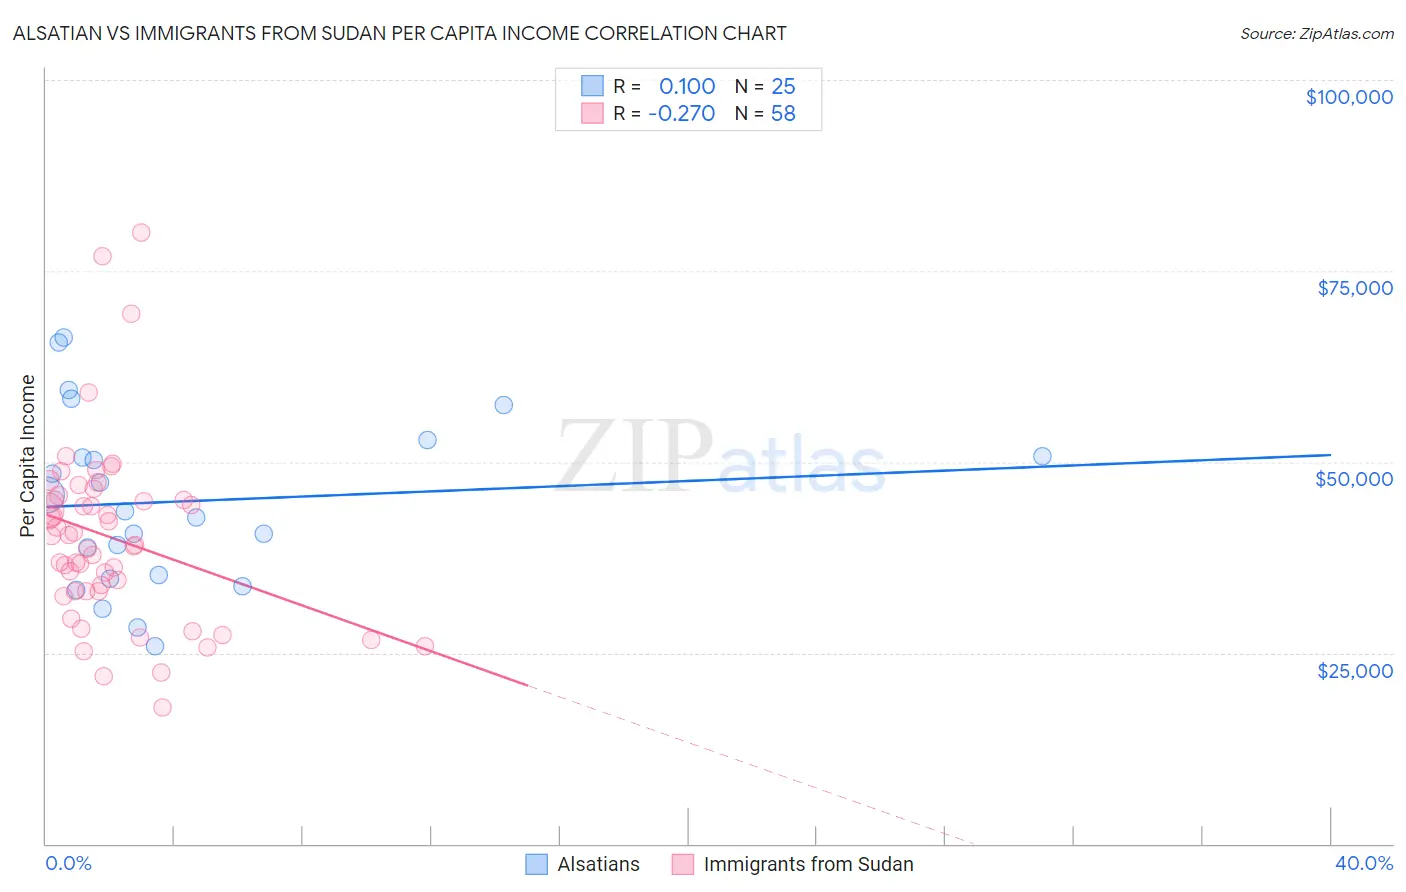
Alsatian vs Immigrants from Sudan Per Capita Income Correlation Chart
The statistical analysis conducted on geographies consisting of 82,682,365 people shows a slight positive correlation between the proportion of Alsatians and per capita income in the United States with a correlation coefficient (R) of 0.100 and weighted average of $47,284. Similarly, the statistical analysis conducted on geographies consisting of 118,972,993 people shows a weak negative correlation between the proportion of Immigrants from Sudan and per capita income in the United States with a correlation coefficient (R) of -0.270 and weighted average of $41,986, a difference of 12.6%.
Per Capita Income Correlation Summary
| Measurement | Alsatian | Immigrants from Sudan |
| Minimum | $25,853 | $17,842 |
| Maximum | $66,221 | $80,005 |
| Range | $40,368 | $62,163 |
| Mean | $44,810 | $40,107 |
| Median | $43,610 | $39,743 |
| Interquartile 25% (IQ1) | $34,894 | $33,055 |
| Interquartile 75% (IQ3) | $51,799 | $45,054 |
| Interquartile Range (IQR) | $16,905 | $11,999 |
| Standard Deviation (Sample) | $11,224 | $11,901 |
| Standard Deviation (Population) | $10,998 | $11,798 |
Similar Demographics by Per Capita Income
Demographics Similar to Alsatians by Per Capita Income
In terms of per capita income, the demographic groups most similar to Alsatians are Carpatho Rusyn ($47,248, a difference of 0.080%), Immigrants from Egypt ($47,361, a difference of 0.16%), Albanian ($47,379, a difference of 0.20%), Immigrants from Zimbabwe ($47,394, a difference of 0.23%), and Immigrants from Moldova ($47,489, a difference of 0.43%).
| Demographics | Rating | Rank | Per Capita Income |
| Northern Europeans | 98.9 /100 | #89 | Exceptional $47,698 |
| Italians | 98.8 /100 | #90 | Exceptional $47,574 |
| Macedonians | 98.8 /100 | #91 | Exceptional $47,573 |
| Immigrants | Moldova | 98.7 /100 | #92 | Exceptional $47,489 |
| Immigrants | Zimbabwe | 98.5 /100 | #93 | Exceptional $47,394 |
| Albanians | 98.5 /100 | #94 | Exceptional $47,379 |
| Immigrants | Egypt | 98.5 /100 | #95 | Exceptional $47,361 |
| Alsatians | 98.3 /100 | #96 | Exceptional $47,284 |
| Carpatho Rusyns | 98.2 /100 | #97 | Exceptional $47,248 |
| Immigrants | Pakistan | 97.9 /100 | #98 | Exceptional $47,084 |
| Laotians | 97.8 /100 | #99 | Exceptional $47,041 |
| Immigrants | Lebanon | 97.5 /100 | #100 | Exceptional $46,938 |
| Immigrants | Uzbekistan | 97.5 /100 | #101 | Exceptional $46,929 |
| Immigrants | Western Asia | 97.4 /100 | #102 | Exceptional $46,876 |
| Syrians | 97.2 /100 | #103 | Exceptional $46,837 |
Demographics Similar to Immigrants from Sudan by Per Capita Income
In terms of per capita income, the demographic groups most similar to Immigrants from Sudan are Ecuadorian ($41,958, a difference of 0.070%), Panamanian ($42,035, a difference of 0.12%), Venezuelan ($42,074, a difference of 0.21%), Immigrants from Panama ($41,853, a difference of 0.32%), and Immigrants from Senegal ($41,830, a difference of 0.37%).
| Demographics | Rating | Rank | Per Capita Income |
| Immigrants | Bosnia and Herzegovina | 17.5 /100 | #202 | Poor $42,278 |
| Spanish | 17.0 /100 | #203 | Poor $42,249 |
| Aleuts | 16.4 /100 | #204 | Poor $42,210 |
| Whites/Caucasians | 15.9 /100 | #205 | Poor $42,180 |
| Ghanaians | 15.7 /100 | #206 | Poor $42,164 |
| Venezuelans | 14.4 /100 | #207 | Poor $42,074 |
| Panamanians | 13.9 /100 | #208 | Poor $42,035 |
| Immigrants | Sudan | 13.2 /100 | #209 | Poor $41,986 |
| Ecuadorians | 12.9 /100 | #210 | Poor $41,958 |
| Immigrants | Panama | 11.6 /100 | #211 | Poor $41,853 |
| Immigrants | Senegal | 11.3 /100 | #212 | Poor $41,830 |
| Immigrants | Venezuela | 10.2 /100 | #213 | Poor $41,727 |
| Immigrants | Bangladesh | 10.1 /100 | #214 | Poor $41,709 |
| Sudanese | 9.9 /100 | #215 | Tragic $41,695 |
| Tongans | 9.9 /100 | #216 | Tragic $41,693 |