Aleut vs Soviet Union Male Poverty
COMPARE
Aleut
Soviet Union
Male Poverty
Male Poverty Comparison
Aleuts
Soviet Union
11.8%
MALE POVERTY
10.4/ 100
METRIC RATING
202nd/ 347
METRIC RANK
11.1%
MALE POVERTY
60.3/ 100
METRIC RATING
160th/ 347
METRIC RANK
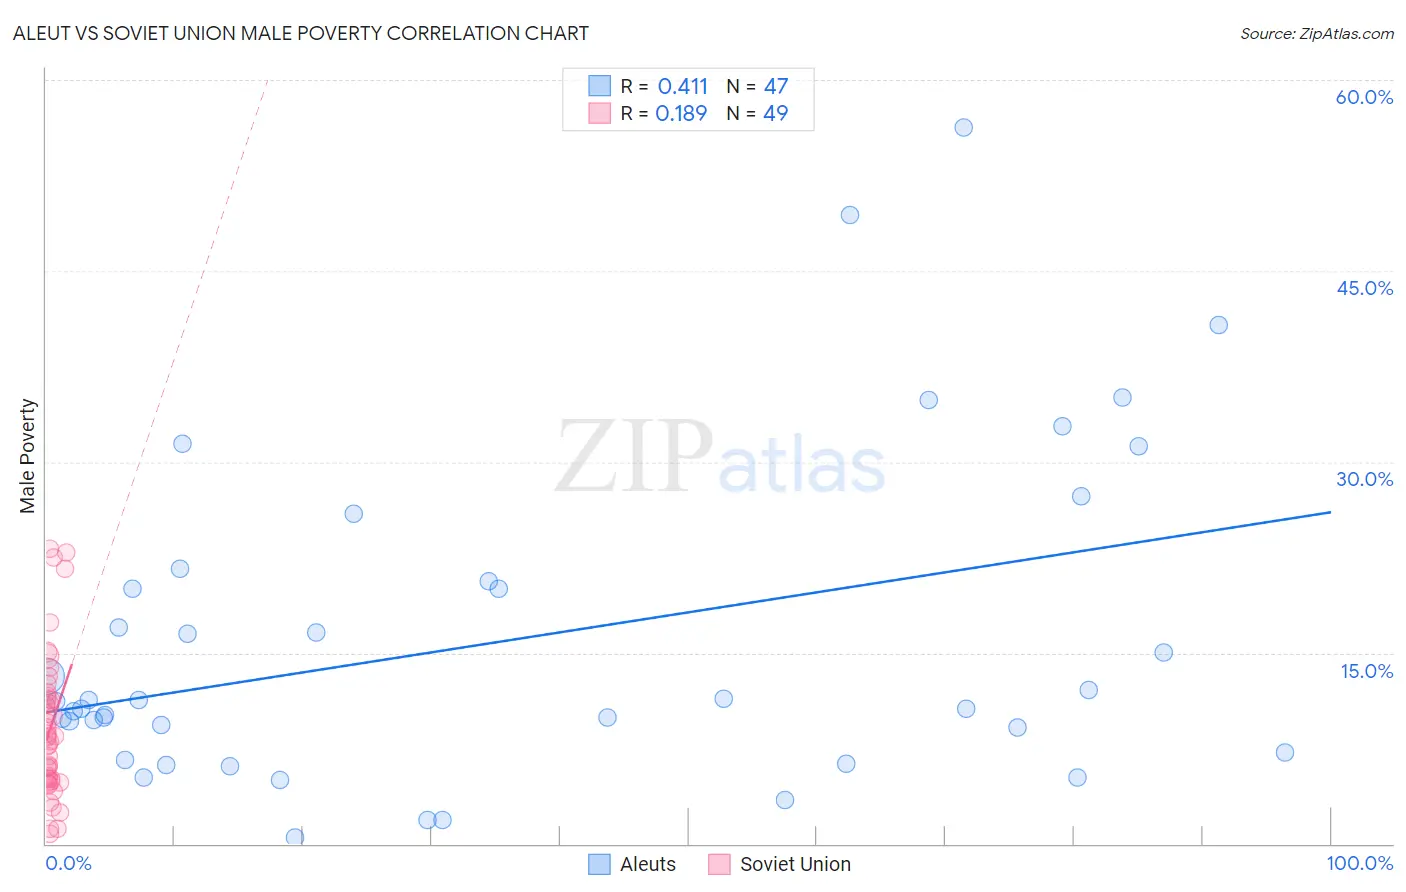
Aleut vs Soviet Union Male Poverty Correlation Chart
The statistical analysis conducted on geographies consisting of 61,774,316 people shows a moderate positive correlation between the proportion of Aleuts and poverty level among males in the United States with a correlation coefficient (R) of 0.411 and weighted average of 11.8%. Similarly, the statistical analysis conducted on geographies consisting of 43,503,005 people shows a poor positive correlation between the proportion of Soviet Union and poverty level among males in the United States with a correlation coefficient (R) of 0.189 and weighted average of 11.1%, a difference of 6.4%.
Male Poverty Correlation Summary
| Measurement | Aleut | Soviet Union |
| Minimum | 0.53% | 0.80% |
| Maximum | 56.2% | 23.2% |
| Range | 55.7% | 22.4% |
| Mean | 15.9% | 9.1% |
| Median | 11.2% | 8.4% |
| Interquartile 25% (IQ1) | 7.1% | 5.0% |
| Interquartile 75% (IQ3) | 20.6% | 11.5% |
| Interquartile Range (IQR) | 13.5% | 6.4% |
| Standard Deviation (Sample) | 12.6% | 5.6% |
| Standard Deviation (Population) | 12.4% | 5.5% |
Similar Demographics by Male Poverty
Demographics Similar to Aleuts by Male Poverty
In terms of male poverty, the demographic groups most similar to Aleuts are Immigrants from Western Asia (11.8%, a difference of 0.14%), Immigrants from Uganda (11.8%, a difference of 0.50%), Spaniard (11.7%, a difference of 0.71%), Immigrants from Lebanon (11.7%, a difference of 0.72%), and Spanish (11.7%, a difference of 0.82%).
| Demographics | Rating | Rank | Male Poverty |
| Arabs | 15.8 /100 | #195 | Poor 11.6% |
| Hmong | 15.8 /100 | #196 | Poor 11.6% |
| Delaware | 15.4 /100 | #197 | Poor 11.7% |
| Iraqis | 14.7 /100 | #198 | Poor 11.7% |
| Spanish | 14.1 /100 | #199 | Poor 11.7% |
| Immigrants | Lebanon | 13.6 /100 | #200 | Poor 11.7% |
| Spaniards | 13.5 /100 | #201 | Poor 11.7% |
| Aleuts | 10.4 /100 | #202 | Poor 11.8% |
| Immigrants | Western Asia | 9.8 /100 | #203 | Tragic 11.8% |
| Immigrants | Uganda | 8.5 /100 | #204 | Tragic 11.8% |
| Panamanians | 6.2 /100 | #205 | Tragic 11.9% |
| Immigrants | Eastern Africa | 5.4 /100 | #206 | Tragic 12.0% |
| Malaysians | 5.2 /100 | #207 | Tragic 12.0% |
| Immigrants | Immigrants | 4.5 /100 | #208 | Tragic 12.0% |
| Immigrants | Azores | 4.3 /100 | #209 | Tragic 12.0% |
Demographics Similar to Soviet Union by Male Poverty
In terms of male poverty, the demographic groups most similar to Soviet Union are Immigrants from Northern Africa (11.1%, a difference of 0.070%), Taiwanese (11.0%, a difference of 0.25%), Colombian (11.0%, a difference of 0.28%), Immigrants from Chile (11.1%, a difference of 0.30%), and Scotch-Irish (11.0%, a difference of 0.35%).
| Demographics | Rating | Rank | Male Poverty |
| Immigrants | Bosnia and Herzegovina | 65.2 /100 | #153 | Good 11.0% |
| Immigrants | Kazakhstan | 64.8 /100 | #154 | Good 11.0% |
| Immigrants | Malaysia | 64.7 /100 | #155 | Good 11.0% |
| Costa Ricans | 63.9 /100 | #156 | Good 11.0% |
| Scotch-Irish | 63.7 /100 | #157 | Good 11.0% |
| Colombians | 63.0 /100 | #158 | Good 11.0% |
| Taiwanese | 62.7 /100 | #159 | Good 11.0% |
| Soviet Union | 60.3 /100 | #160 | Good 11.1% |
| Immigrants | Northern Africa | 59.7 /100 | #161 | Average 11.1% |
| Immigrants | Chile | 57.4 /100 | #162 | Average 11.1% |
| Whites/Caucasians | 56.7 /100 | #163 | Average 11.1% |
| Ethiopians | 56.7 /100 | #164 | Average 11.1% |
| Immigrants | Spain | 55.5 /100 | #165 | Average 11.1% |
| Immigrants | Albania | 55.3 /100 | #166 | Average 11.1% |
| Hungarians | 55.1 /100 | #167 | Average 11.1% |